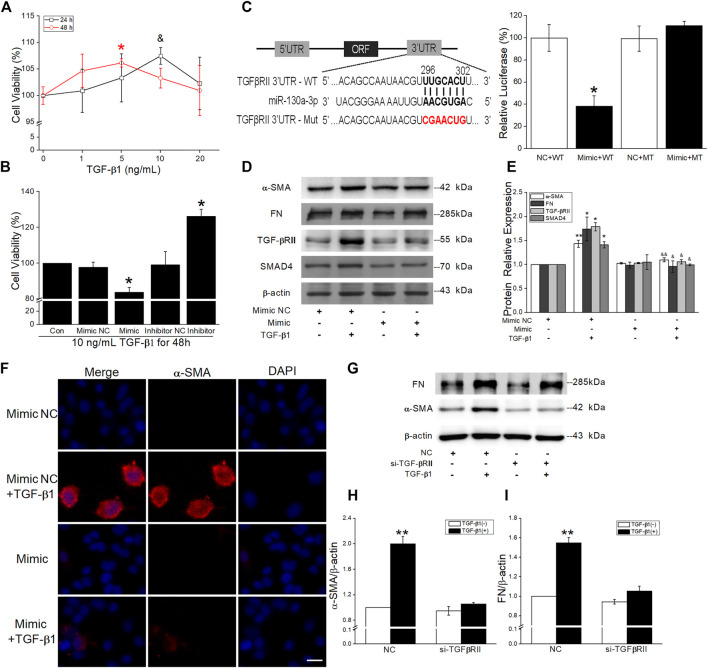
FIGURE 9.
Effect of miR-130a-3p on the differentiation in TGF-β1-induced MRC-5. (A-B) CCK-8 assay was used to detect cell viability of MRC-5 cells under TGF-β1 stimulation, and the data for 0 ng/ml or control group was set to 100%. *p < 0.05, versus 0 ng/ml (48 h) or the control group; & p < 0.05, versus 0 ng/ml (24 h), by the Mann–Whitney U test, n = 3–5. (C) Predicted binding sites of miR-130a-3p with TGF-βRII-3′UTR (left). Dual luciferase reporter assays of miR-130a-3p and TGF-βRII. *p < 0.05, versus the NC + WT group, one-way ANOVA followed by Bonferroni’s test, n = 3–4. (D-E) Representative and statistical data of α-SMA, FN, TGF-βRII, and SMAD4 proteins in MRC-5 after transfection of miR-130a-3p mimic. *p < 0.05, **p < 0.01, versus the Mimic NC group; & p < 0.05, && p < 0.01, versus the Mimic NC + TGF group, by the Mann–Whitney U test, n = 4–6. (F) Immunofluorescence staining for α-SMA after miR-130a-3p mimic administration. α-SMA-positive (red) and DAPI (blue). Scale bar = 50 μm. (G-I) Representative and statistical data of α-SMA and FN proteins in MRC-5 after transfection of small interfering RNA for TGF-βRII (si-TGF-βRII). **p < 0.01, versus NC group, by the Mann–Whitney U test, n = 4-5.

