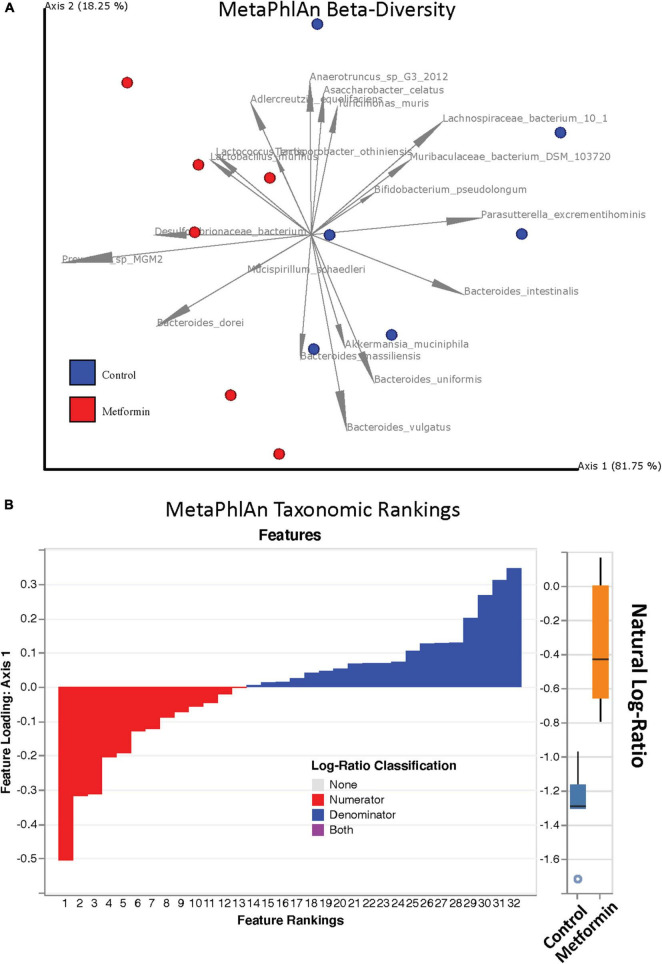
FIGURE 1.
(A) Robust Aitchison PCA plot of metagenome samples processed through MetaPhlAn 3 and DEICODE and visualized with qurro. Bacterial species not present in at least 50% of samples were removed from the analysis. Separation of Control and Metformin treated groups was significant (p-value 0.002). (B) Corresponding log-ratio rankings for individual bacterial taxa oriented to Axis 1 (right). Numerator (red) / Denominator (blue) ratios of these taxa were computed to generate a box-whisker plot (left), p-value 0.0025. These results were corroborated with songbird analyses.

