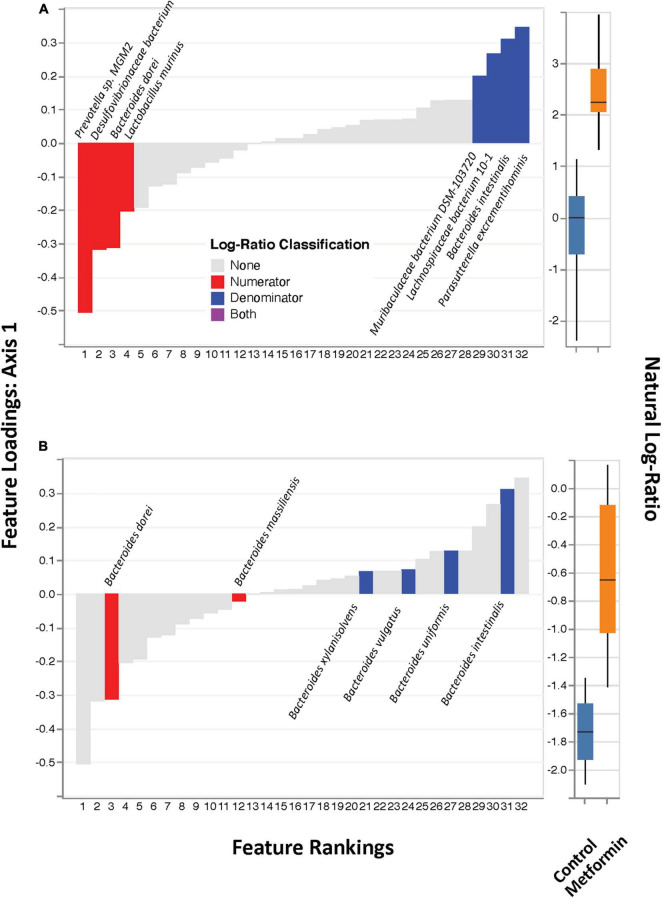
FIGURE 2.
DEICODE feature rankings. (A) Same plot as in Figure 1, with only the top-feature rankings selected (left), and their ratios plotted as a box-whisker-plot (right). (B) Only Bacteroides spp. selected (left) and their ratios plotted as box-whisker plot (right).

