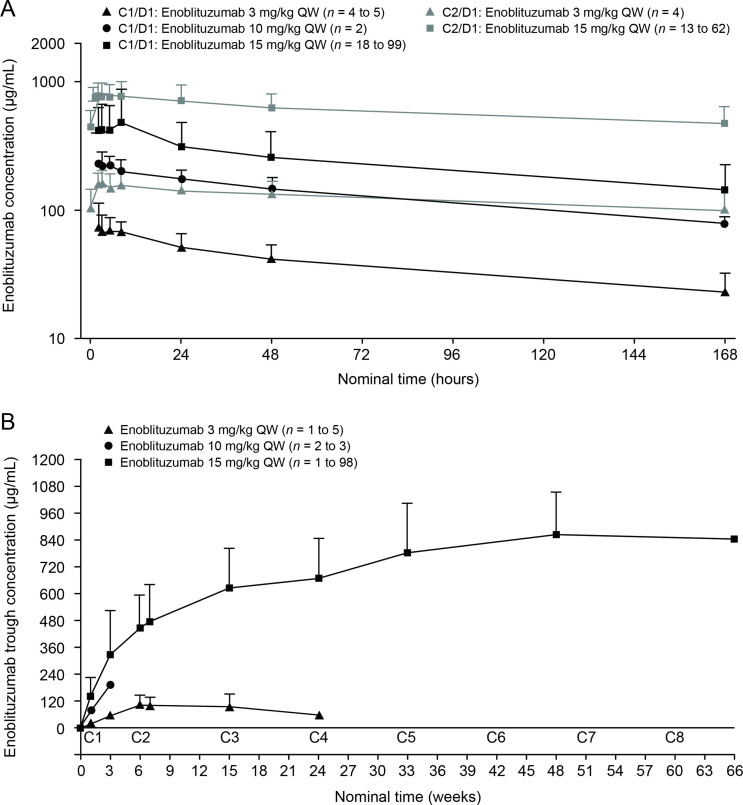
Figure 3.
Pharmacokinetics of enoblituzumab after 2-hour intravenous infusions of 3–15 mg/kg QW. (A) Serum concentration–time profiles (semi-log scale). (B) Serum trough concentrations. Symbols and error bars represent arithmetic means and SDs, respectively. The duration of time between C1 and C2 was 6 weeks. C, cycle; D, day; QW, once weekly.

