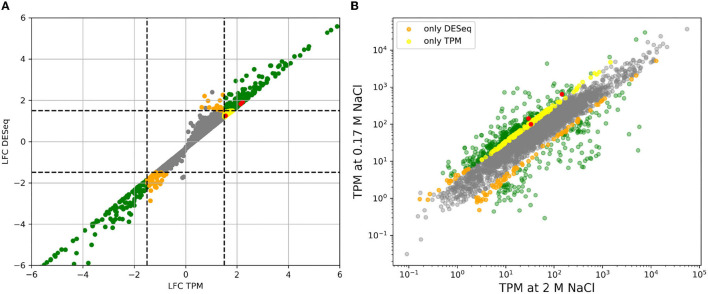
Figure 1.
(A) Comparison of log2-fold-changes (LFC) between low salt (0.17 M NaCl) and high salt (2 M NaCl) obtained using TPM count vs. DESeq. Dashed lines mark the threshold for differential expression. (B) Comparison of TPM counts between high and low salt. Genes that are considered to be differentially expressed by both methods are plotted in green. Only by DESeq in orange and only by TPM count in yellow. The three genes for PHB synthesis have been taking as a reference and marked in red since accumulation of PHB granules is clearly higher in cells growing at low salt compared to those growing at high salt. See below.

