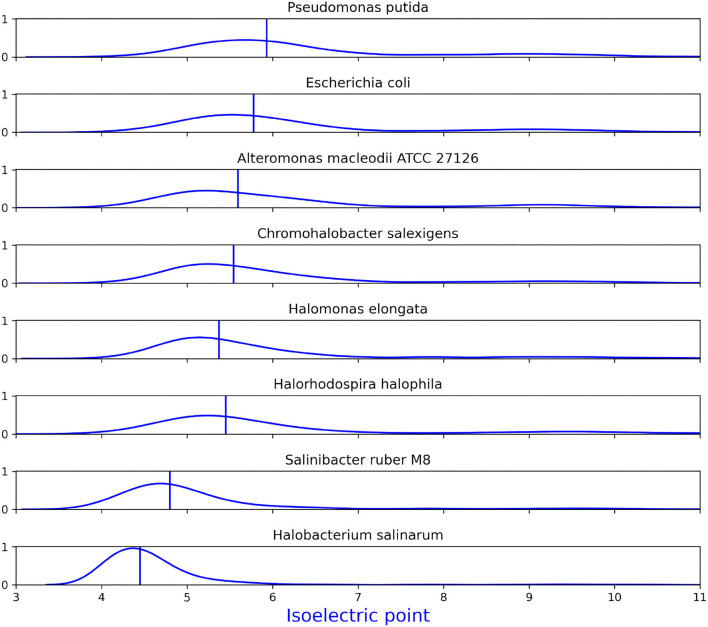
Figure 10.
Distribution of isoelectric points in the cytosolic proteins of several prokaryotes as density plots. Vertical lines show the median for each plot. The amount of genes to which psort could assign a reliable location varies from one bacteria to another as does the fraction of this that were classified as cytosolic. The amount of proteins identified as cytosolic was: Pseudomonas putida: 2457, Escherichia coli: 1935, Alteromonas macleodii ATCC 27126: 1616, Chromohalobacter salexigens: 1726, Halomonas elongata: 1958, Halorhodospira halophila: 1301, Salinibacter ruber M8: 1358, Halobacterium salinarum: 1250.

