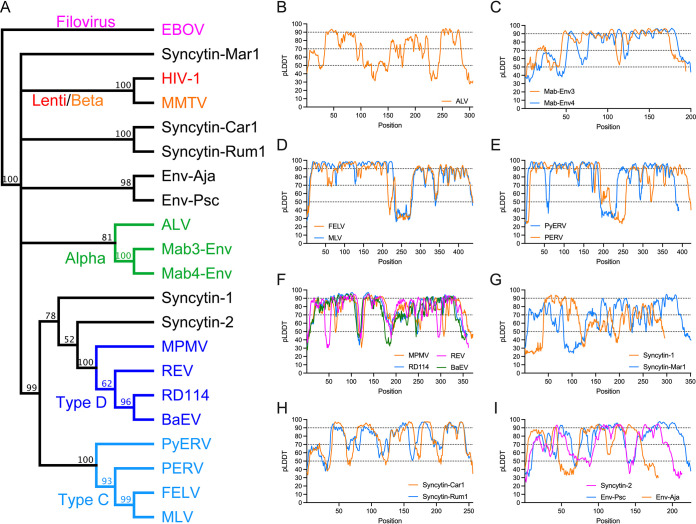
FIG 1.
Modeling of orthoretroviral SU. (A) Relationship of orthoretroviral TM and filoviral GP2 transmembrane subunit ectodomain sequences. A neighbor-joining cladogram was generated with Geneious Prime using Ebola virus GP2 to root the cladogram. Orthoretroviral and filoviral groups are color-coded as indicated in the cladogram except for unclassified gammaretroviruses, which are shown in black. Numbers indicate node support (percent) from 1,000 bootstrap runs. (B to I) pLDDT scores of SU models. pLDDT scores along the SU sequence are indicated for each model, grouping similar models in the same panels.

