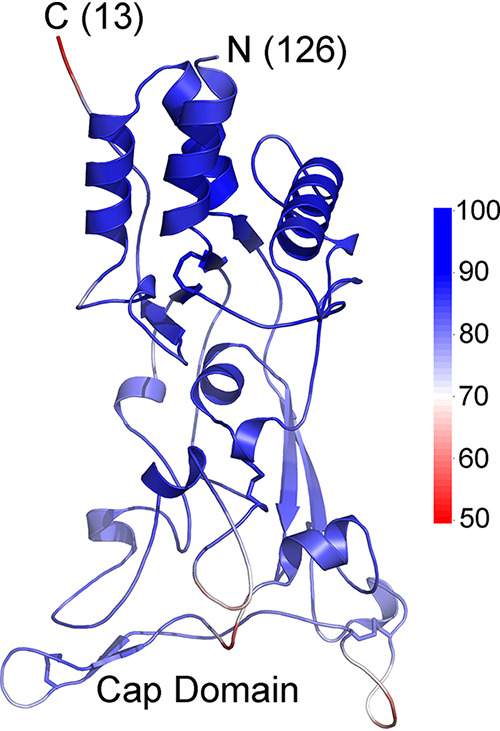
FIG 10.

African green monkey simian foamy retrovirus SU model. The modeled structure is shown with colors indicating pLDDT scores along the chain, with the scale shown to the right. The amino and carboxy termini of the model are indicated with the number of residues not modeled on each end. The amino-terminal section outside the model shown has helical regions that do not pack with the rest of the SU and are not structurally similar to the SU of orthoretroviruses. Disulfide bonds are indicated by sticks. All cysteine residues in the modeled region participate in disulfide bonds. A cap minidomain located distally relative to the chain termini is indicated.
