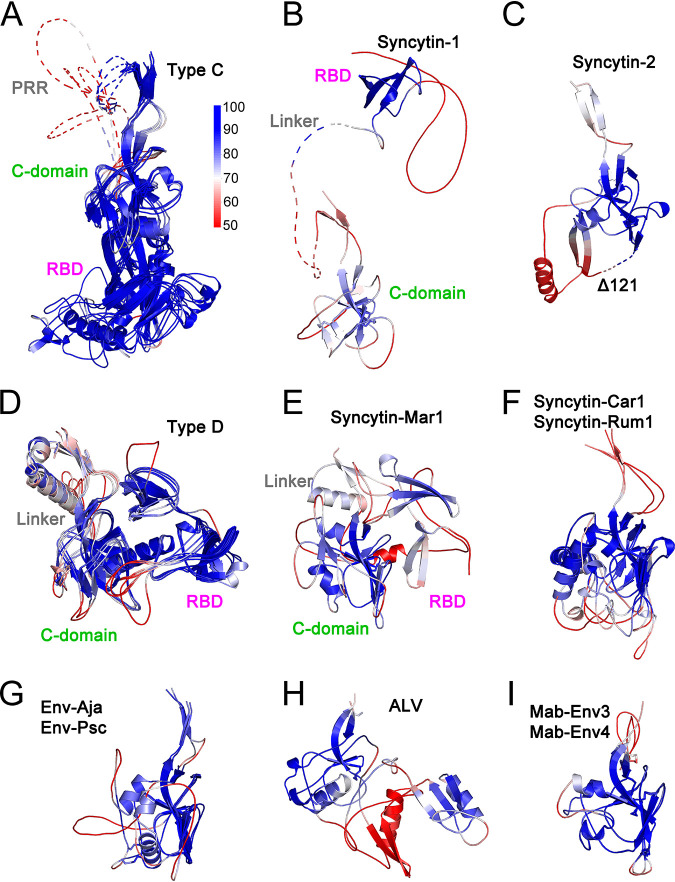
FIG 3.
pLDDT scores mapped on orthoretroviral SU models. pLDDT scores are mapped on cartoon representations of type C gammaretroviruses (A), syncytin-1 (B), syncytin-2 (C), type D gammaretroviruses (D), syncytin-Mar1 (E), syncytin-Car1 and Rum1 (F), Env-Aja and Env-Psc (G), ALV (H), and Mab-Env3 and Mab-Env4 (I). Models are shown in the same order and orientation as in Fig. 2. The pLDDT score scale is shown next to panel A. Low-confidence model regions with scores below 50 are shown in red. Unstructured PRR and linker regions are shown as dotted lines. The RBD, C-domains, PRR, and linker regions of type C, type D, syncytin-1, and syncytin-Mar1 are indicated. The deletion in the syncytin-2 model is indicated as dotted lines in panel C.

