FIG 6.
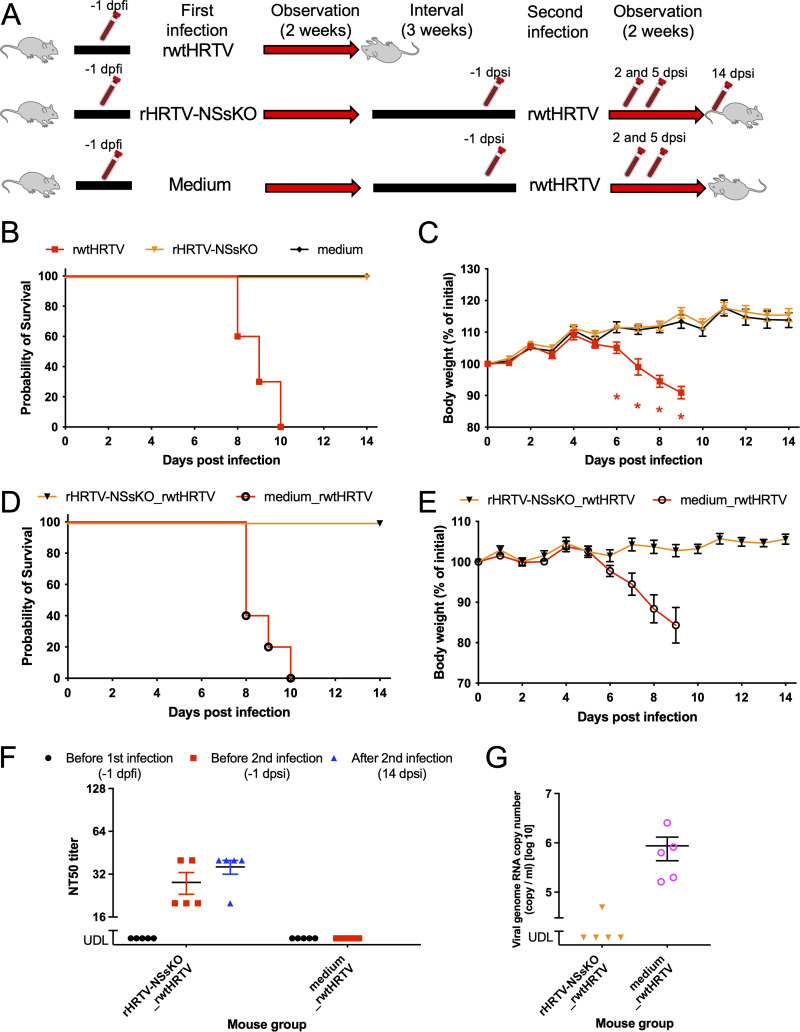
Virulence of rHRTV-NSsKO in AG129 mice and the potential of the viruses to develop anti-HRTV live-attenuated vaccines. (A) Diagram of the protocols. Mice (n = 10/group) were infected with 1.0 × 10² FFU of recombinant viruses denoted in the column labeled “first infection” and were observed for 2 weeks. Five weeks after the first infection, half of survivors (n = 5/group) were further infected with 1.0 × 10² FFU of rwtHRTV. Blood collection tubes in the diagram indicate the collection of blood samples, which were collected −1 day post-first infection (dpfi) and −1, 2, 5, and 14 days post-second infection (dpsi). (B) Survival curves of the first infection experiment. P < 0.001 (rwtHRTV versus rHRTV-NSsKO). (C) Body weight changes of infected mice of the first infection experiment performed in B. (D) Survival curves of the second infection experiment. P = 0.0015 (rHRTV-NSsKO_rwtHRTV versus medium_rwtHRTV). (E) Body weight changes of infected mice in the second infection experiment performed in D. (F) Kinetics of neutralization titers against HRTV in infected mice. NT50 values of plasma samples collected −1 days before first infection (dpfi), −1 (before second infection), and 14 days post-second infection (dpsi). (G) HRTV viral RNA loads in plasma samples collected 5 dpsi. Error bars in C, E, F, and G represent the SEM. *, q <0.05 (rwtHRTV versus rHRTV-NSsKO). UDL, under detection limit.

