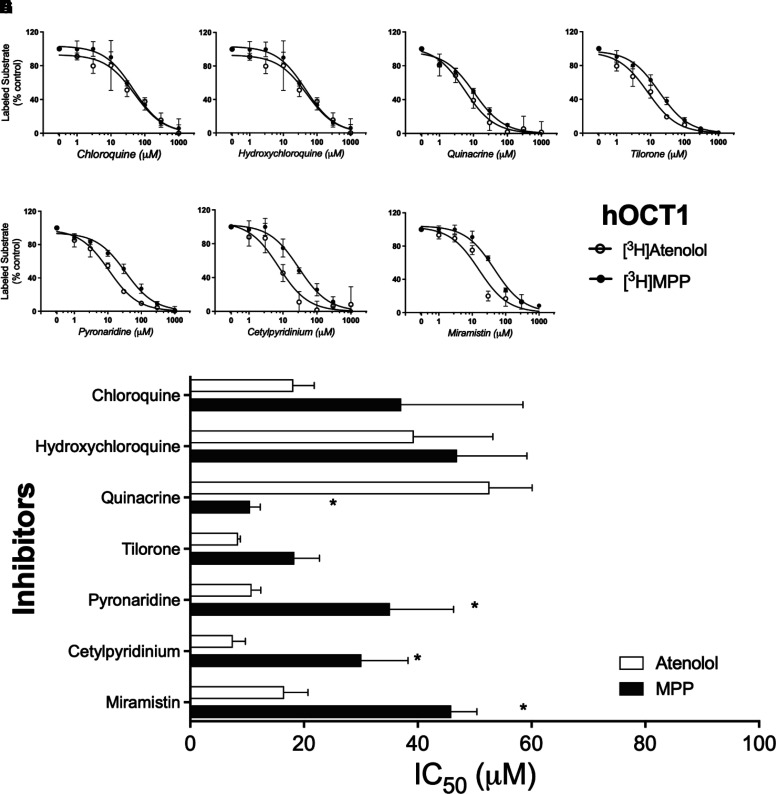
Fig. 6.
Inhibition of labeled substrate (atenolol or MPP) uptake in hOCT1-expressing CHO cells by chloroquine (A), hydroxychloroquine (B), quinacrine (C), tilorone (D), pyronaridine (E), cetylpyridinium (F), and miramistin (G). Two min uptakes (pH 7.4) of ∼15 nM [3H]MPP or 200 nM [3H]atenolol were measured in the presence of increasing concentrations of each inhibitor. Each point is the mean (±S.D.) of results determined in two or more separate experiments. The bar graph (H) compares inhibitor constants (IC50) generated against the two substrates (atenolol or MPP) for each of the inhibitors. *Indicates the different value that was significant at the level of P < 0.05

