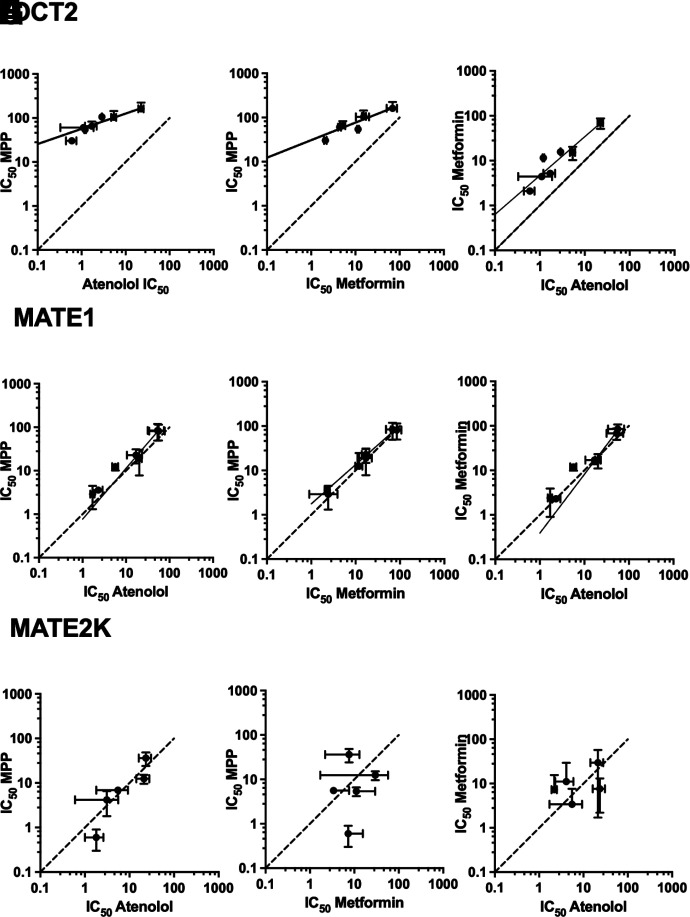
Fig. 7.
Pairwise comparison of log IC50 values for inhibition of OCT2- (A, B, and C), MATE1- (D, E, and F), and MATE2-K- (G, H, and I) mediated transport of each substrate by the tested inhibitors. Dashed lines represent equivalent inhibition of the compared substrates; the solid line represents a simple linear regression of the data.

