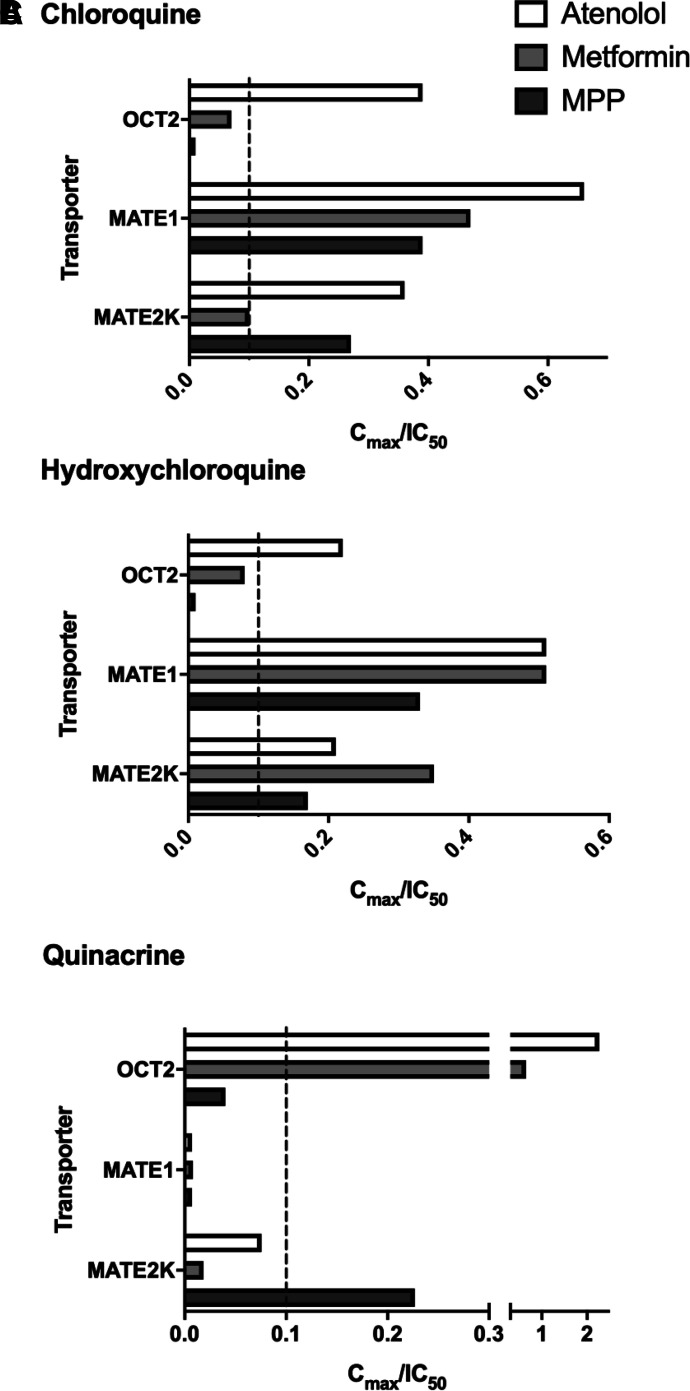
Fig. 8.
Bar graph represents Cu,max/IC50 ratios and their relation to the 0.1 cutoff value (for recommending a clinical DDI study) for chloroquine (A), hydroxychloroquine (B), and quinacrine (C) generated against OCT2, MATE1, and MATE2-K. Data were taken from Table 2.

