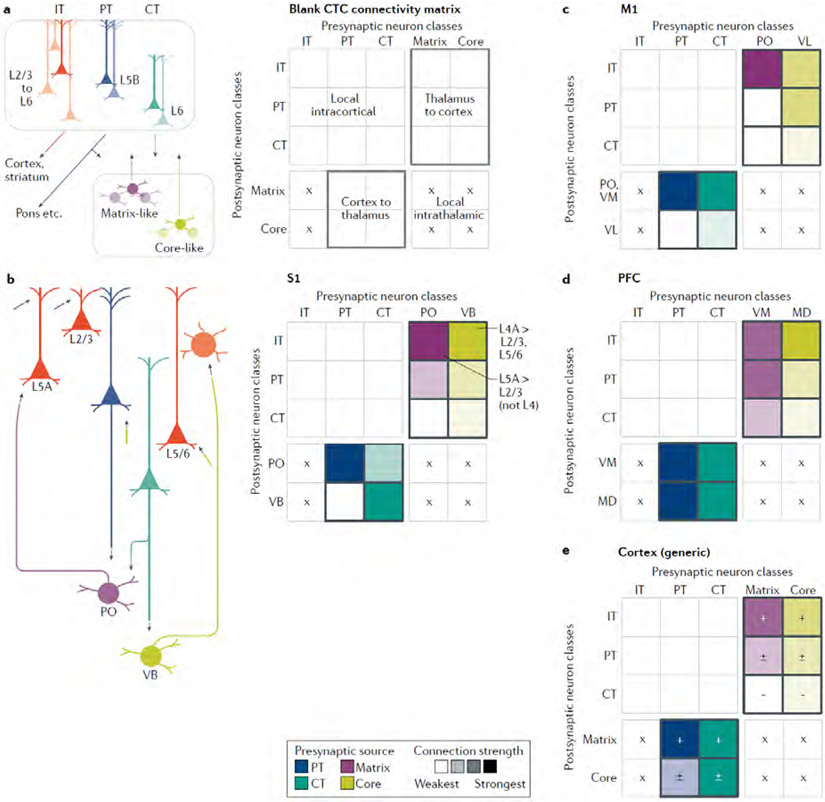
Fig. 2 ∣. Cell-type-specific cortico-thalamo-cortical connectivity matrices across areas.
a ∣ The major classes of excitatory projection neurons in the cortex and thalamus are drawn schematically (left), along with their ‘blank’ connectivity matrix (right), highlighting the boxes representing connections directly involved in cortico-thalamo-cortical (CTC) loops, from the thalamus to cortex (upper right) and the cortex to thalamus (lower left). Crosses (×) mark where connections cannot form owing to a lack of projections from the presynaptic source. b ∣ For the primary somatosensory cortex (S1), a wiring diagram (left) and connectivity matrix (right) are shown, incorporating findings for both vibrissal-related and forelimb-related S1, as discussed in detail in the main text46-51,53-64. The matrix was assembled by filling in each element based on a qualitative interpretation and weighting of experimental results, often from multiple studies, that have quantitatively measured the strengths of connections between specific presynaptic→postsynaptic combinations. For example, the matrix element in the upper right corner represents the strength of excitatory input from presynaptic ventrobasal (VB) axons to postsynaptic IT neurons (in this case primarily those in layer 4). The colour intensities represent the connection strengths (darker = stronger). The colours differ by column to represent the different types of presynaptic neurons. This colour scheme also emphasizes that most measurements have been experimentally determined by comparing the strength of input from a single presynaptic source to two or more postsynaptic targets, rather than vice versa. Accordingly, comparisons between matrix elements tend to be more robust along the columns than along the rows. For example, the relative strengths of VB inputs to different types of cortical neurons have been directly tested, whereas the relative strengths of VB and PO inputs to any one type of cortical neurons have not. c,d ∣ The same approach was taken to generate a CTC connectivity matrix for primary motor cortex (M1), incorporating findings for both vibrissal and forelimb related M1 31,33,48,68-70,72-78, and for the prefrontal cortex (PFC) 80-82 e ∣ An ‘average’ CTC connectivity matrix for cortical areas was assembled based on qualitative comparison across areas, including those considered above, ALM, A1, V1 and others, as discussed in the main text 25,52,75,84-94,101,102 Connections that tend to be found consistently are marked with ‘+’ and stronger colours, those that tend to be more variable with ‘±’ and intermediate colours, and those that tend to be weak or absent with ‘−’ and the lightest colours.

