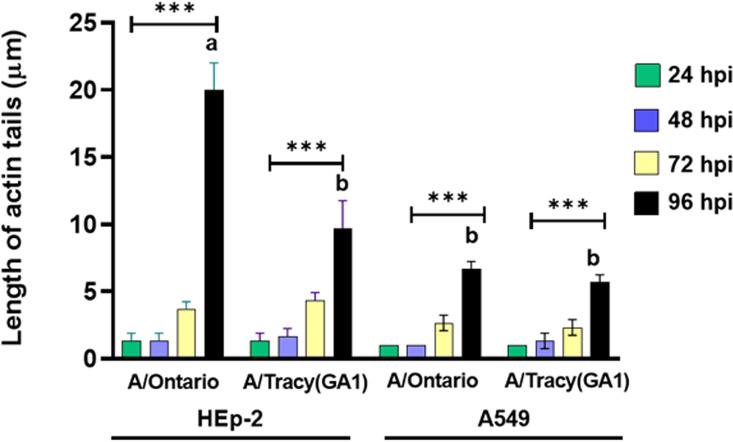
FIG 5.
Quantification of the length of actin tails in RSV/A-infected HEp-2 and A549 cells. Data shown were gathered from three independent samples with three replicates per group in each experiment and are represented as mean ± SD. Asterisks indicate statistical significance determined by two-way ANOVA with Tukey’s multiple-comparison test, P < 0.001 (***). Bars with different letters are significantly different from each other, P < 0.01.

