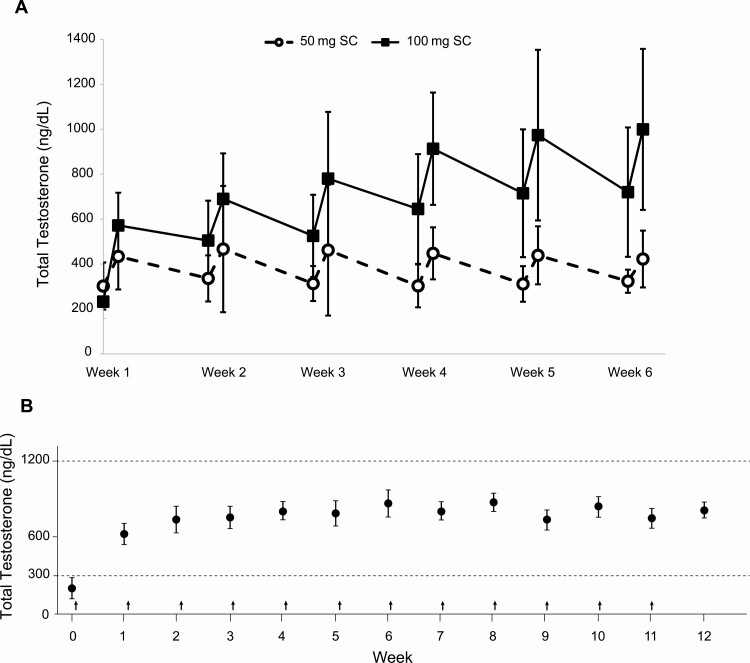
Figure 3.
A, Mean serum total testosterone concentrations in men on 50 and 100 mg subcutaneous (SC) testosterone enanthate measured predose (0 hour) and 24 hours post dose. Adapted with permission from (25). B, Mean serum testosterone concentrations with weekly 100 mg intramuscular administration of testosterone enantathe to men with primary hypogonadism (vertical arrows represent injections, error bars represent SEM, and dashed lines represent normal range. Adapted with permission from (46).

