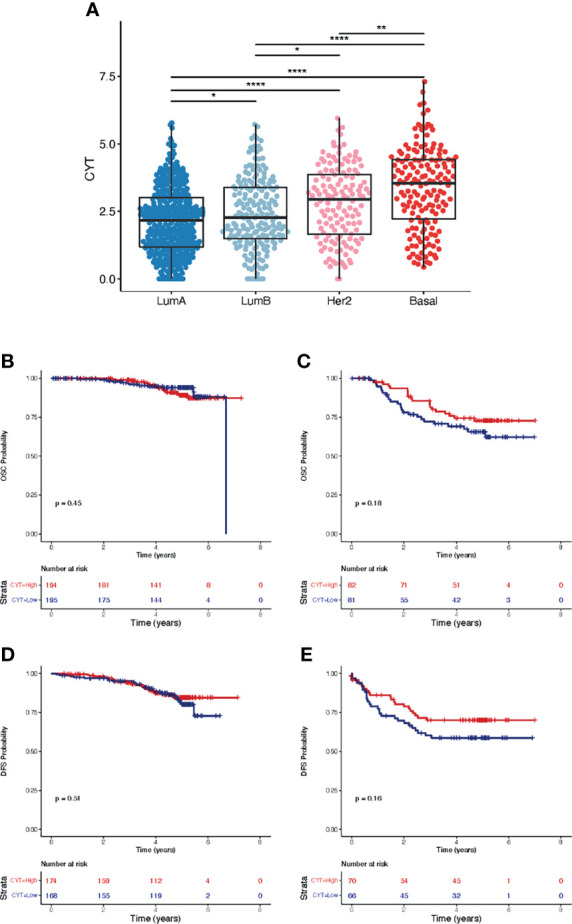
Figure 7.

Cytolytic score CYT and survival analysis according to PAM50 subtypes in the MPBCS cohort. (A), distribution of CYT among PAM50 subtypes. Medians were compared using the Kruskal-Wallis test (p= 2.2e-16). Adjusted p-values for the paired comparisons using Dunn’s test are defined as follows: *< 0.05, **< 0.01, ****< 0.0001. (B, C), Kaplan-Meier curves and survival analysis for cancer-related overall survival (OSC) according to a binary assignation of high (i.e. above median) and low CYT to LumA (B) and Basal (C) tumors. (D, E), Kaplan-Meier curves and survival analysis for disease-free survival (DFS) according to the same binary assignation of high (i.e. above median) and low CYT to LumA (D) and Basal (E) tumors.
