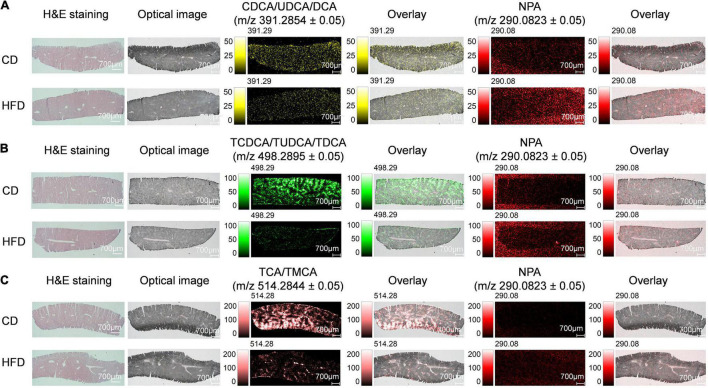
FIGURE 1.
MS imaging-based visual mapping profiles of BAs distributed within regions of liver. MS ion images representing spatial distributions of NPA (m/z 290.0823 ± 0.05) and the identified BAs at CDCA/UDCA/DCA m/z 391.2854 ± 0.05 (A), TCDCA/TUDCA/TDCA m/z 498.2895 ± 0.05 (B) and TCA/TMCA m/z 514.2844 ± 0.05 (C) for the whole section of mouse liver (Scale bars: 1,000 μm). Overlay: Overlay of each MS ion image and optical image. All ion images were normalized to the 9AA matrix signal. Abbreviation: CD, control diet group; HFD, high-fat diet group.

