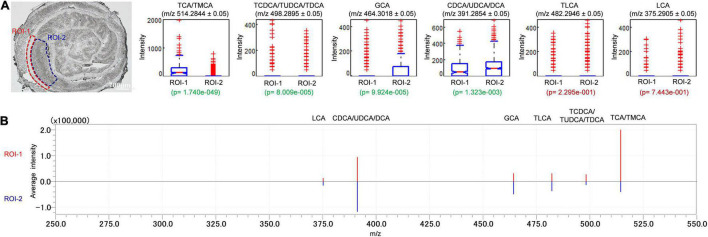
FIGURE 5.
Distribution profiles of BAs in colon were studied through comparison of relative intensities of BAs by the values of p between ROI-1 and ROI-2. Signal intensities of targeted BAs in ROI of two different regions of colon were depicted and signal normalization was performed by pixel. ROI-1: submucosa, muscular layer and adventitia; ROI-2: mucosa layer. The letter ‘p’ denotes the statistical p-value of the comparison, significant differences were highlighted in green font while insignificant differences were highlighted in red font (A). The spectrum of each ROI which set in (A). The spectra were vertically inverted, with that of ROI-1 above in red and that of ROI-2 below in blue (B).

