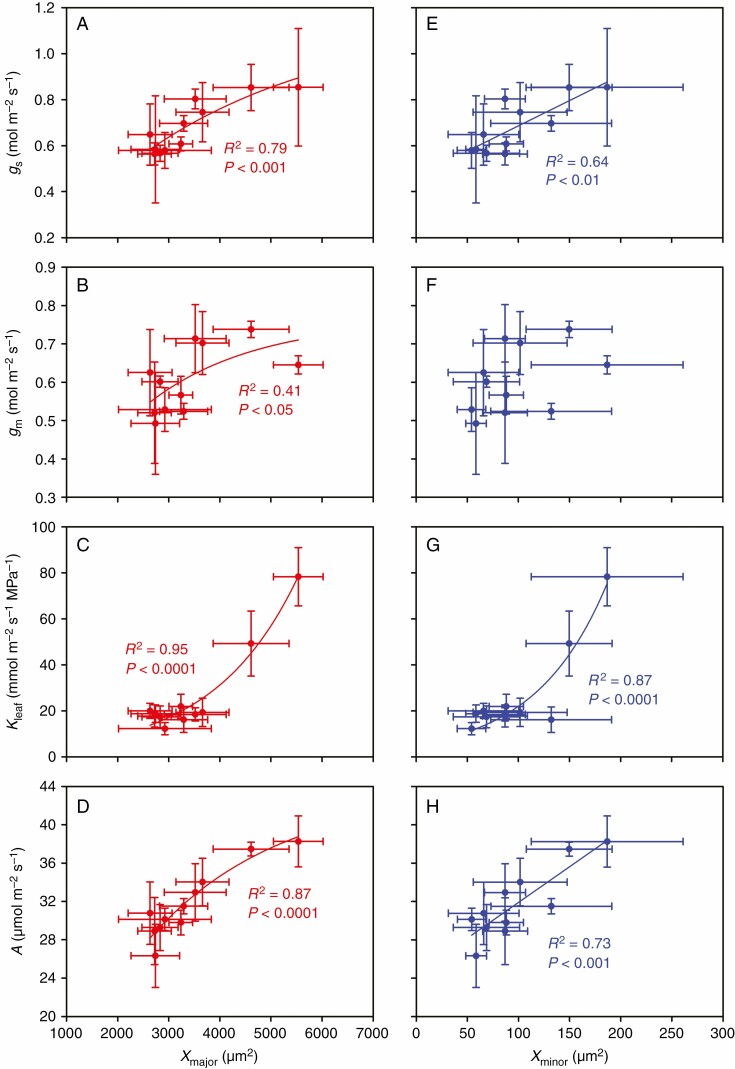
Fig. 2.
Relationships between total area of xylem conduits per major and per minor veins (Xmajor and Xminor) and gs, gm, Kleaf and A. The data points are the means ± s.d. of 3–5 biological replicates for Xmajor, Xminor, A, gs and gm, and of 4–8 biological replicates for Kleaf. Both linear and non-linear models were fitted, and the model with the lowest residual sum of squares is shown. Model equations: (A) gs = 1.16(1 – e–0.0003Xmajor), (B) gm = 0.76(1 – e–0.0005Xmajor), (C) Kleaf = 2.83e0.0006Xmajor, (D) A = 43.7(1 – e–0.0004Xmajor), (E) gs = 0.0022Xminor + 0.47, (G) Kleaf = 5.3e0.0142Xminor and (H) A = 0.0745Xminor + 24.5. Xmajor, xylem area per major vein; Xminor, xylem area per minor area; gs, stomatal conductance; gm, mesophyll conductance; Kleaf, leaf hydraulic conductance; and A, leaf photosynthetic rate.

