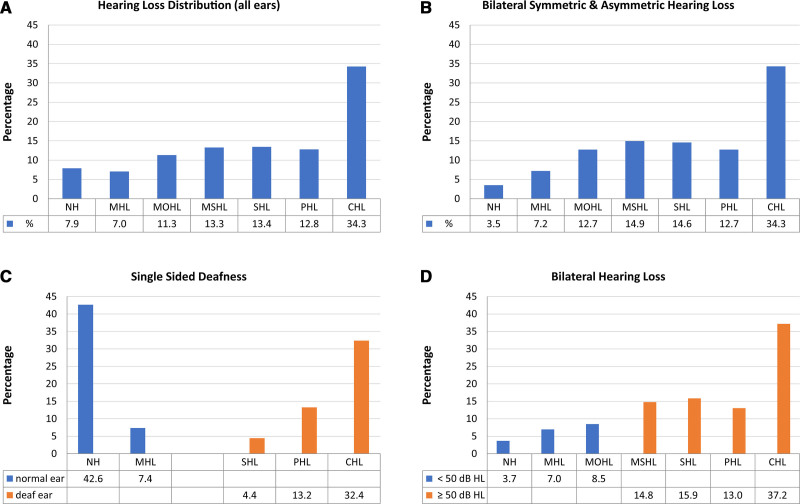
Fig. 2.
Distribution of hearing loss grades in the cohort. A, Distribution of hearing loss grades for all single ears (n = 610). B, Distribution of hearing loss grades for probands with bilateral symmetric (n = 241) and asymmetric (n = 30) hearing loss (AHL) (better ear: PTA >30 and ≤55 dB HL; poorer ear PTA ≥70 dB HL; interaural threshold gap ≥15 dB HL). C, Distribution of hearing loss grades for probands with single-sided deafness (SSD) (n = 34); better ear (blue bars): PTA ≤30 dB HL; poorer ear (orange bars): PTA ≥70 dB HL; interaural threshold gap: ≥40 dB HL; according to the consensus framework for SSD and AHL (Van de Heyning et al. 2016). D, Separation of bilateral mild and moderate (<50 dB HL) hearing loss (blue bars) (n = 88) and higher-grade (≥50 dB HL) bilateral hearing loss (orange bars) (n = 372) for single ears. NH, normal hearing (−10.0 to 19.9 dB HL); MHL, mild hearing loss (20.0 to 34.9 dB HL); MOHL, moderate hearing loss (35.0 to 49.9 dB HL); MSHL, moderately severe hearing loss (50.0 to 64.9 dB HL); PHL, profound hearing loss (80.0 to 94.9 dB HL); SHL, severe hearing loss (65.0 to 79.9 dB HL); CHL, complete or total hearing loss (≥95.0 dB HL). Classification follows the recommendations of the Global Burden of Disease (GBD) Expert Group on Hearing Loss (Global Burden of Disease Hearing Loss Expert Group et al. 2013; Olusanya et al. 2019a). Percentage values for different hearing loss grades are shown below bars.

