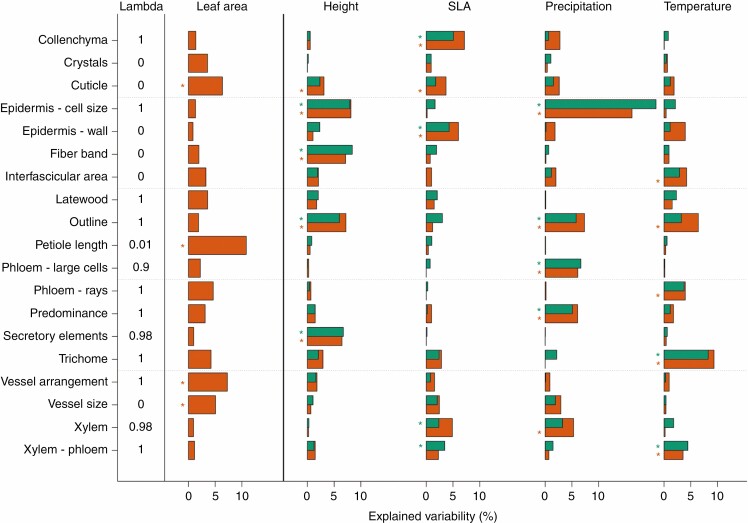
Fig. 2.
Explained variability in individual anatomical traits by LA, height, SLA, precipitation and temperature. Brown bars show explained variability accounting only for the covariate LA; green bars denote explained variability after accounting for the other predictors (including LA). *P < 0.05. In the left column is the estimated strength of the phylogenetic signal in each model (Pagel’s lambda). LA = leaf area, SLA = specific leaf area.

