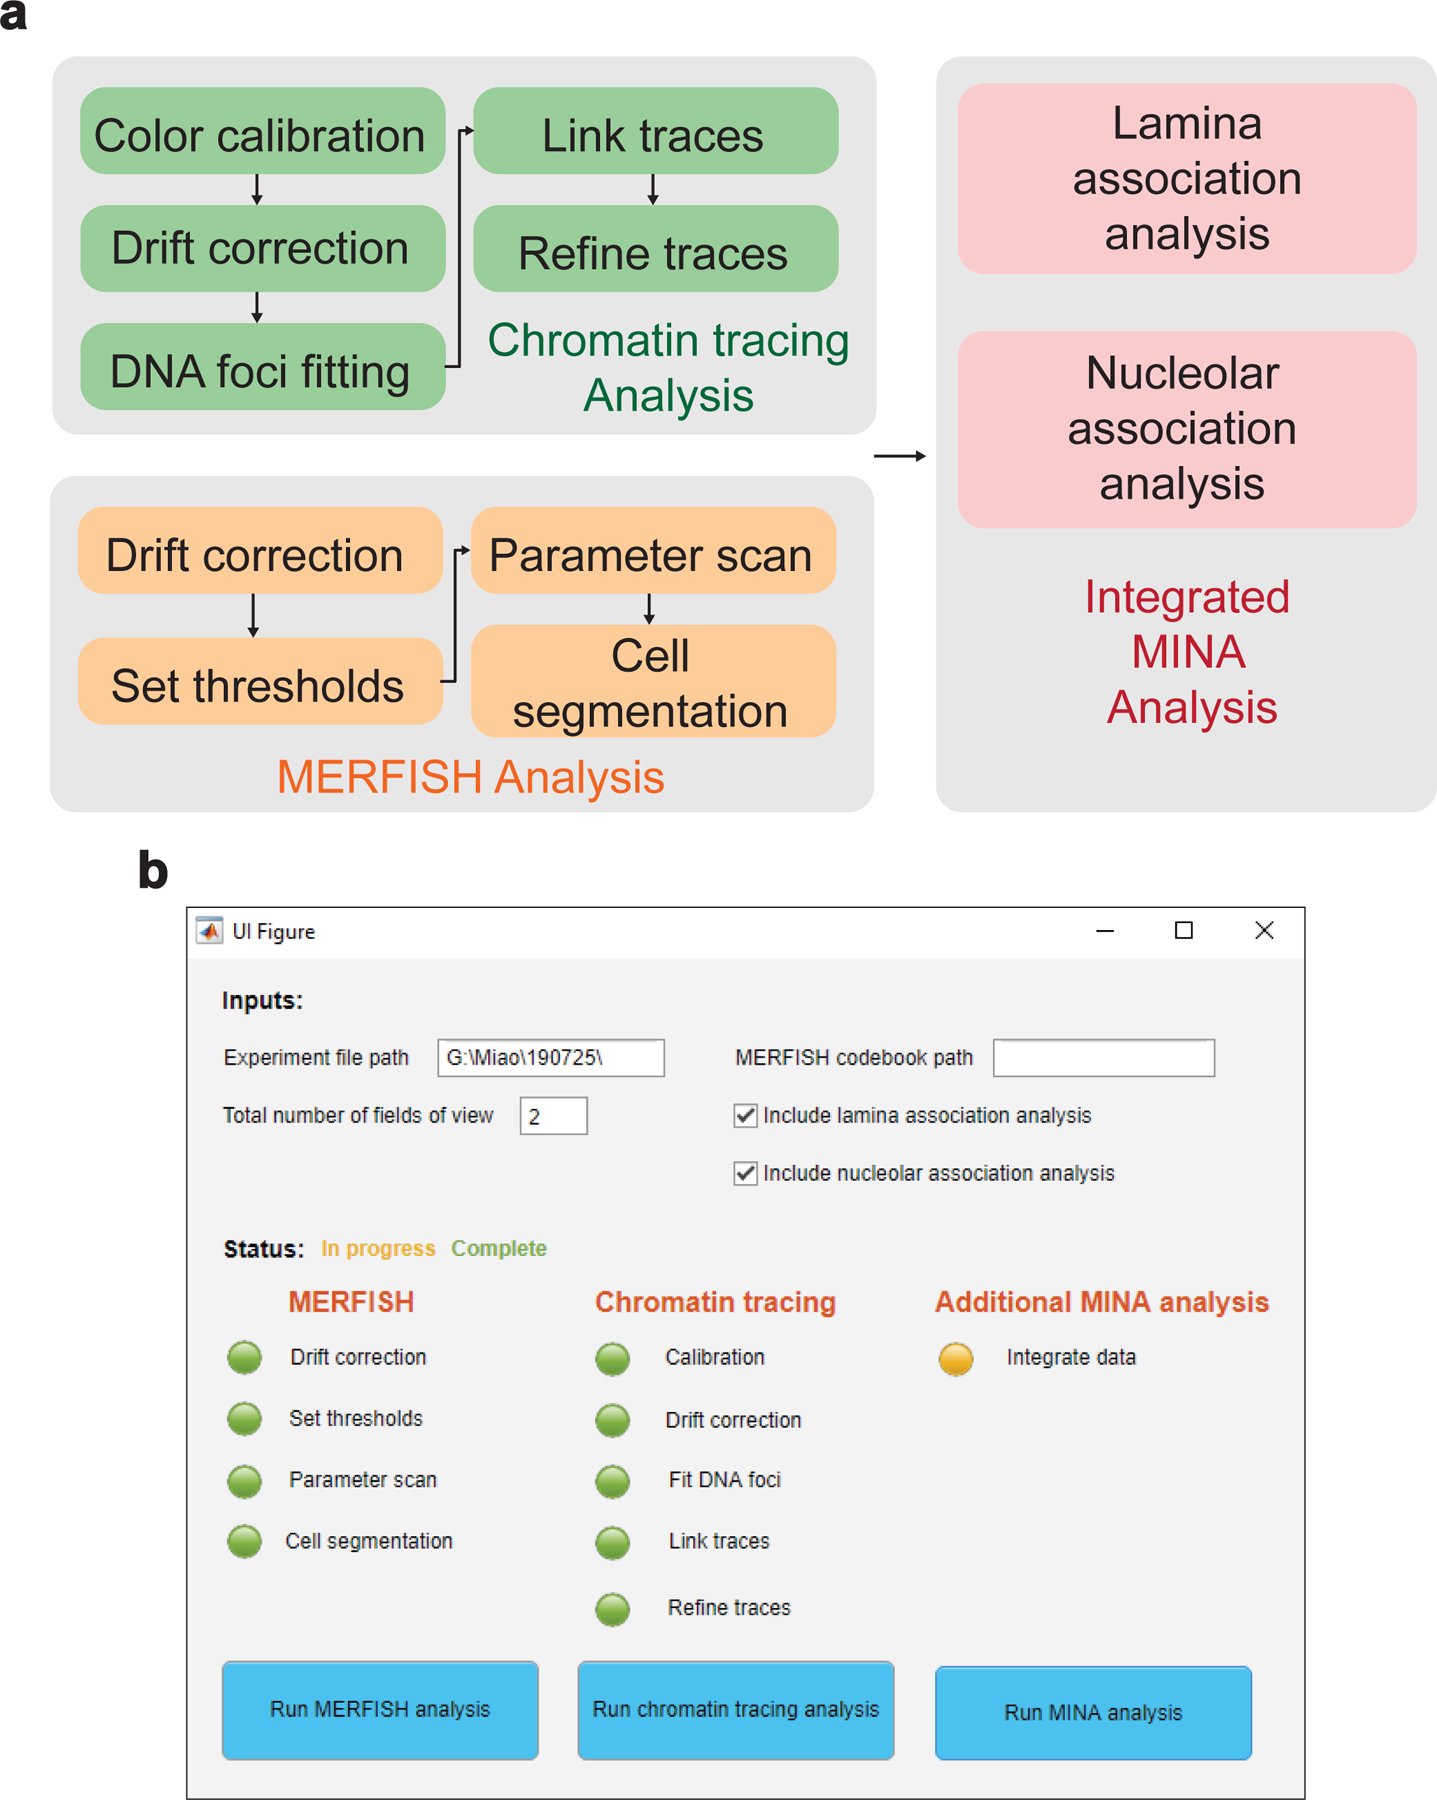
Fig.5. Data analysis with MinaAnalyst.

a, Data analysis pipeline with MinaAnalyst. Raw images are separately analyzed with MERFISH and chromatin tracing analyses, followed by integrated MINA analysis. b, MATLAB GUI for the MinaAnalyst application. Required inputs include experiment file path for raw images and total number of FOVs. Optional inputs include MERFISH codebook path and whether to include nuclear lamina and nucleolar association analyses. Users can choose different analysis options by clicking the corresponding buttons.
