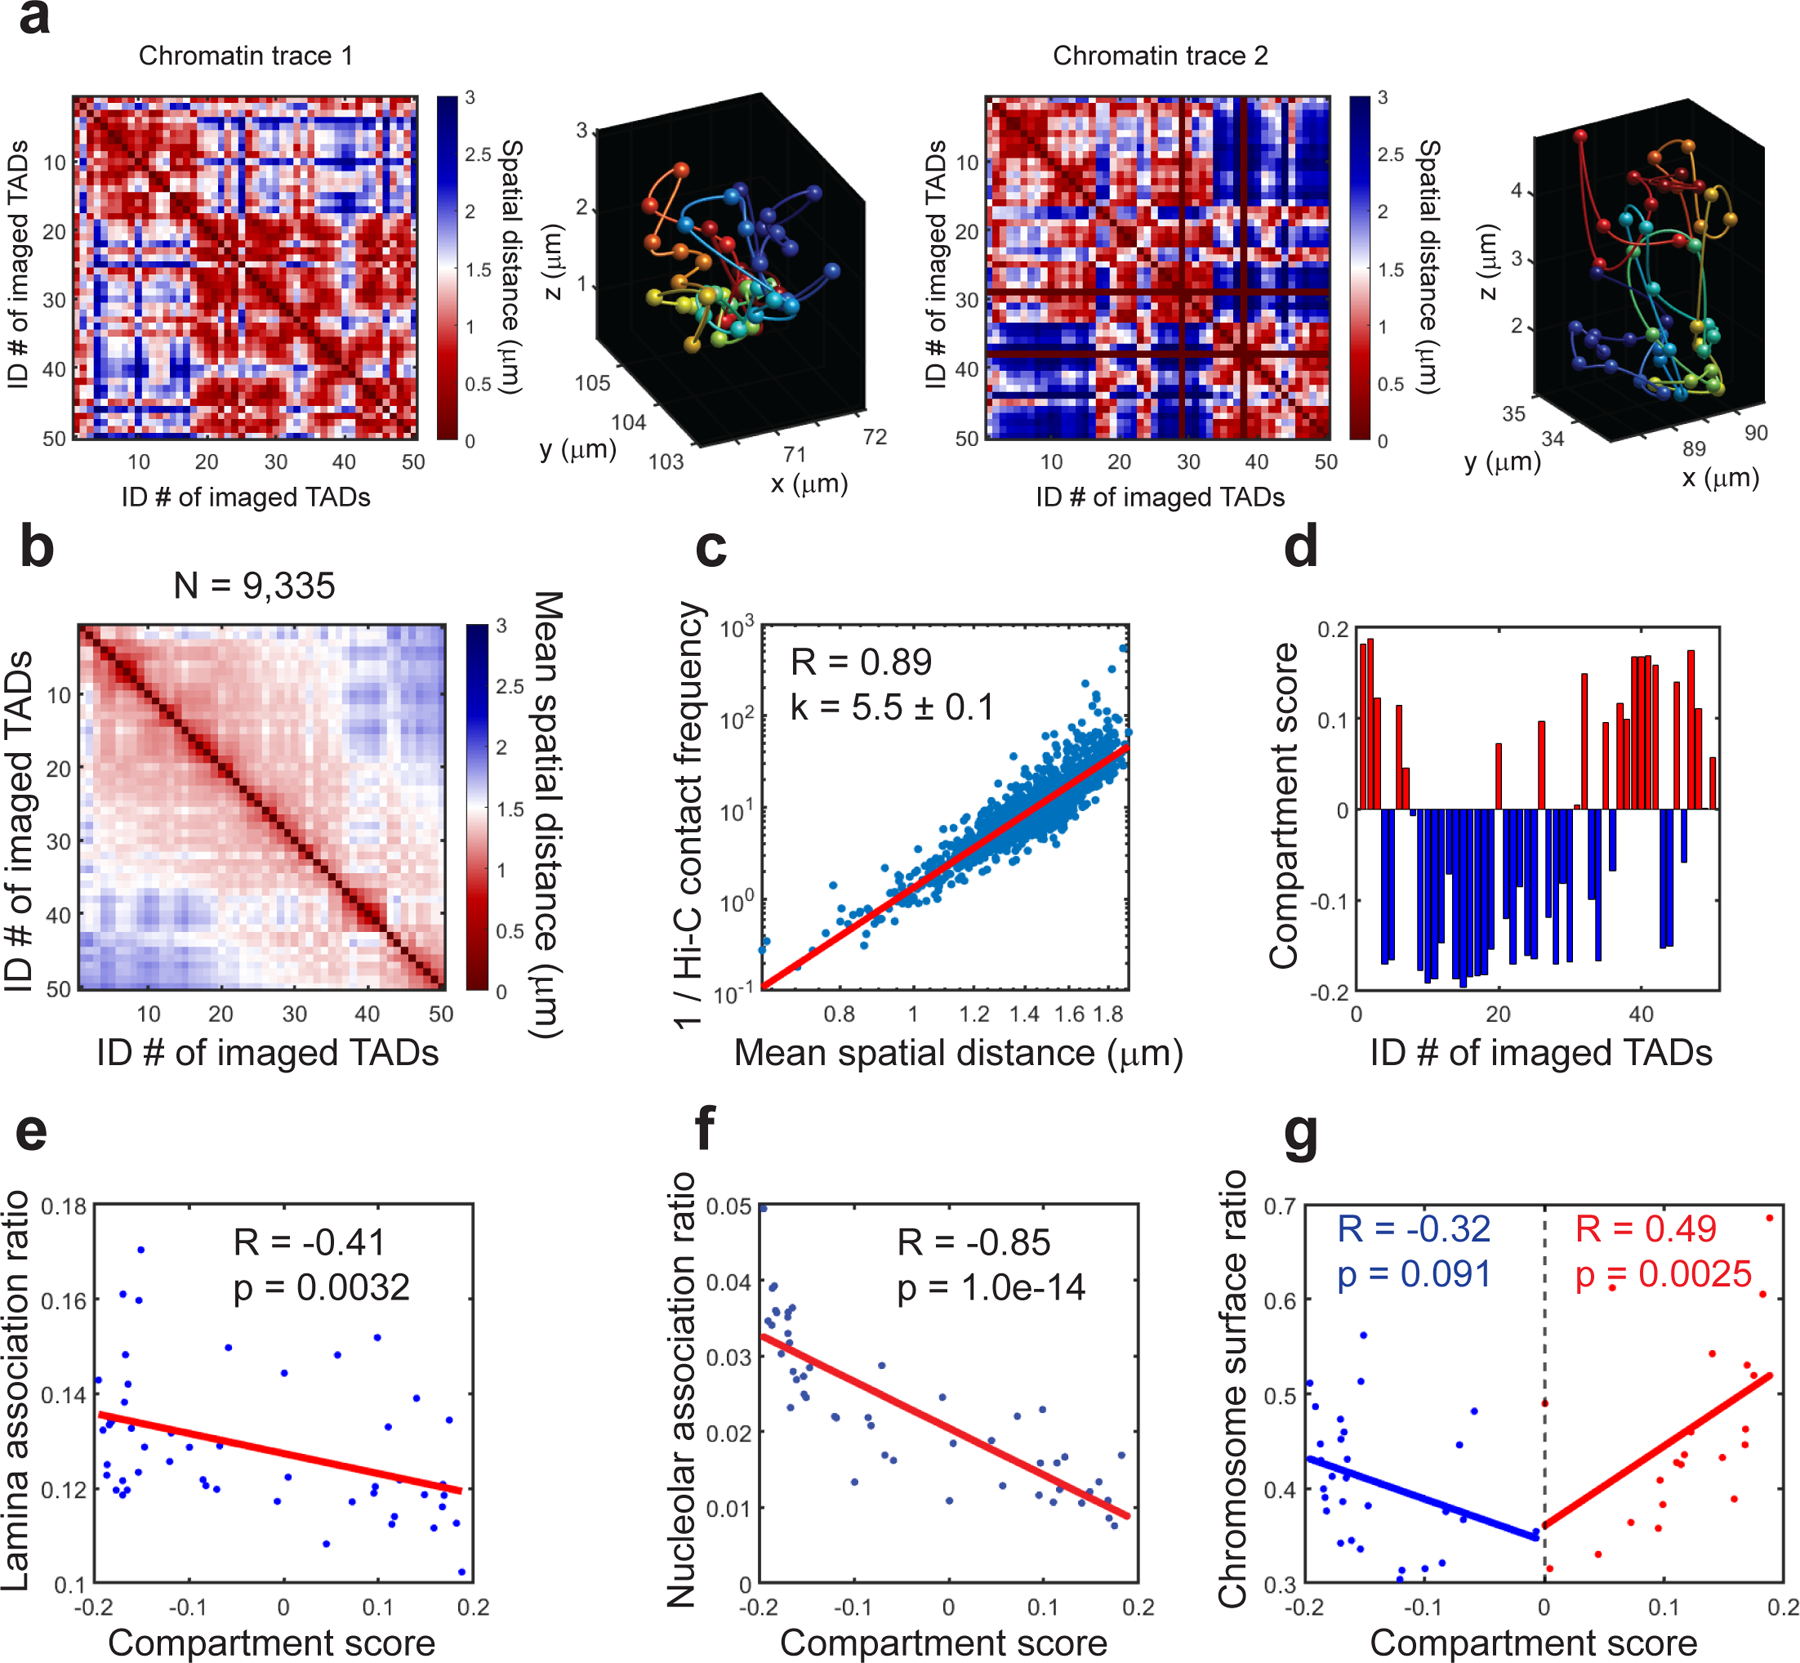
Fig.7. Example results of single-copy and ensemble analyses of chromatin tracing.

a, Two single-copy chromatin traces of mChr19 in mouse fetal liver. (Left panels) Spatial distance matrices of the two single-copy chromatin traces. Each matrix element represents the spatial distance between a pair of imaged TADs in the chromatin trace. (Right panels) The reconstructed chromatin traces in 3D, with TADs represented by pseudo-colored spheres connected by smooth curves to guide the eye. b, Mean spatial distance matrix for mChr19 TADs. Each element represents the mean spatial distance between a pair of imaged TADs. A total of 9,335 copies of mChr19 are analyzed. c, Correlations between the inverse Hi-C contact frequency and mean spatial distances. d, Compartment scores of imaged TADs. Red bars: compartment A TADs. Blue bars: compartment B TADs. e, Correlation between lamina association ratios and compartment scores of mChr19 TADs. f, Correlation between nucleolar association ratios and compartment scores of mChr19 TADs. g, Correlation between chromosome surface ratios and compartment scores of mChr19 TADs. Red and blue dots represent compartment A and B TADs, respectively. This figure is generated using one replicate from the published MINA work18. All experiments performed are approved by IACUC of Yale University. Raw data are provided in SourceData_Fig7.
