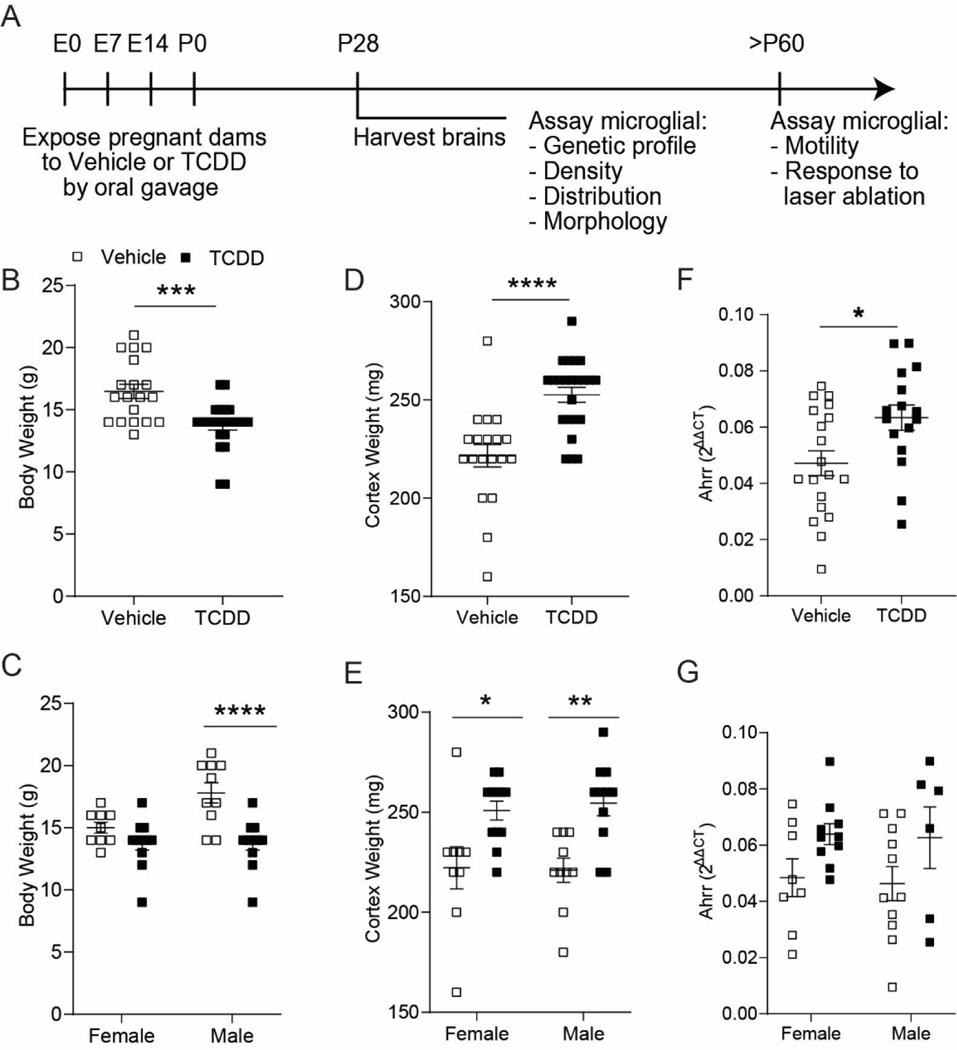
Figure 1.
(A) Timeline of perinatal TCDD exposure. (B) C57Bl/6J mice exposed to TCDD weighed significantly less than vehicle-exposed mice at P28 (n = 19–24 animals per group; unpaired t-test, P = 0.0002) (C) This weight loss was evident only in TCDD-exposed males (n = 9–12 animals per group; two-way ANOVA, interaction: P = 0.0274; sex: P = 0.0274; exposure: P < 0.0001; Bonferroni post-hoc, females: P = 0.3236; males: P < 0.0001). (D) P28 TCDD-exposed cortices weighed significantly more compared to vehicle-exposed cortices (n = 19–23 animals per group; unpaired t-test, P < 0.0001). (E) This weight gain was evident in both TCDD-exposed males and females (n = 9–12 animals per group; two-way ANOVA, interaction: P = 0.7214; sex: P = 0.8571, exposure: P < 0.0001; Bonferroni post-hoc, females: P = 0.0114; males: P = 0.0026). (F, G) Ahrr expression is significantly increased following perinatal TCDD exposure, with no significant sex difference (n=16–19 animals per group; unpaired t-test, P < 0.0150). *P < 0.05, **P < 0.01, ***P < 0.001, ****P < 0.0001 vs. vehicle. Graphs show individual data points and mean ± SEM.

