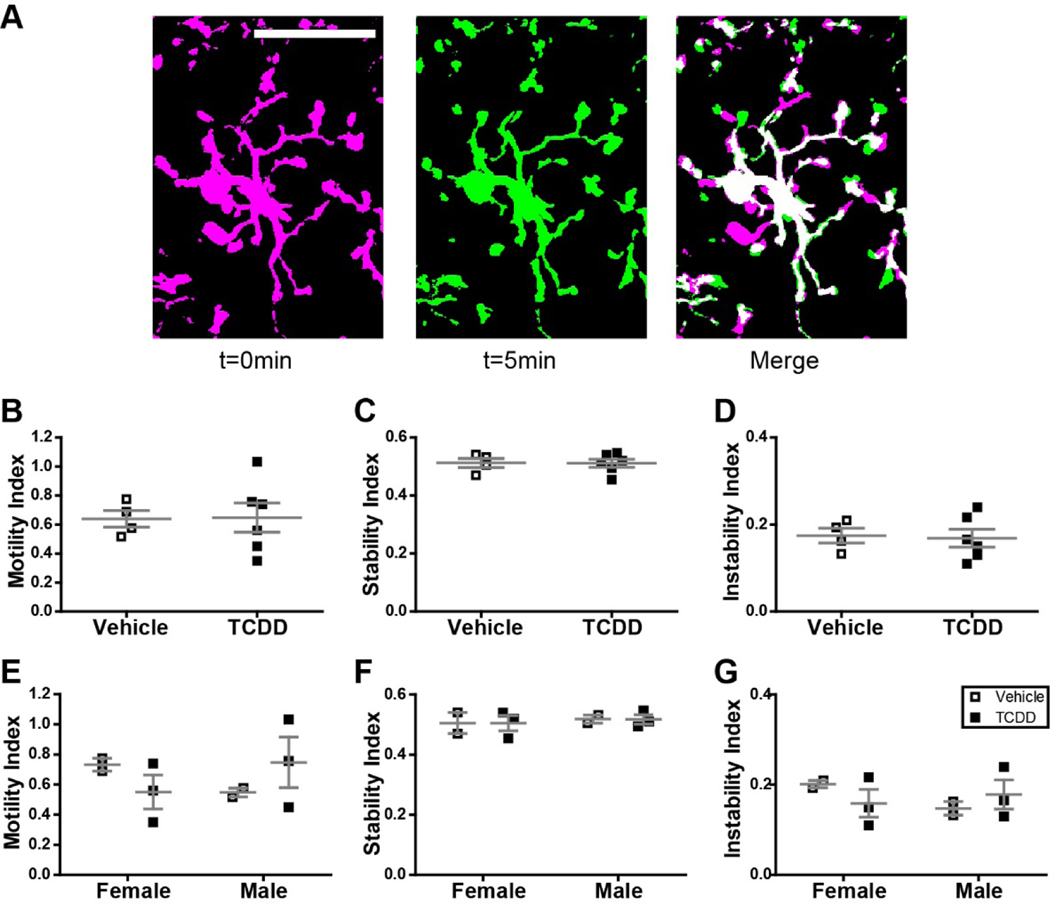
Figure 6.
(A) Schematic representation of motility analysis. Images of Cx3cr1G/+ mice developmentally exposed to either vehicle or TCDD were collected every 5 minutes for 1 hour. To assay process motility, each microglia was analyzed individually across all time points. Time point t = 0 minutes was pseudocolored magenta, time point t = 5 minutes was pseudocolored green, and the two time points were overlaid to generate the merged image. In this image, magenta pixels represent processes which have retracted, green pixels represent pixels which have extended, and white pixels represent processes which remained stable. This analysis was performed for all adjacent pairs of time points. Scale bar = 20μm. (B-G) There is no significant difference in microglia process motility, stability, or instability across treatment groups in the combined data set or when analyzed for effect of sex. Graphs show individual data points and mean ± SEM.

