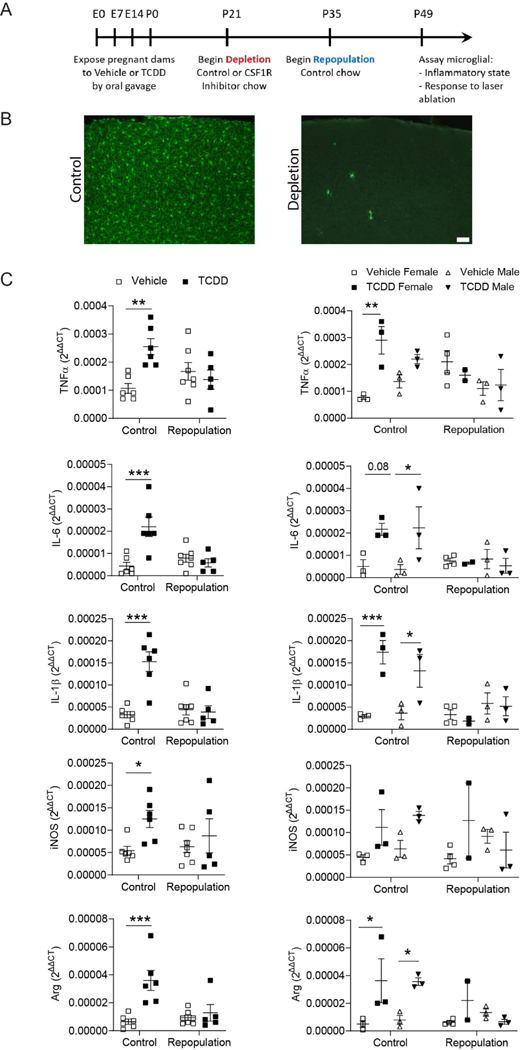
Figure 8.
(A) Timeline of microglial repopulation. (B) Representative images of control microglia and microglial depletion following treatment with CSF1R inhibitor. Scale bar = 50μm. (C) RTqPCR analysis of Tnf-α, IL-6, Il-1β, iNos, and Arginase mRNA expression from P49 cortices of C57Bl/6J mice exposed to vehicle or TCDD during gestation and lactation and later receiving control chow or chow containing a CSF1R inhibitor. TCDD-exposed mice had significantly increased expression compared to their vehicle-exposed equivalents only in the control chow condition. Following microglial repopulation, expression levels did not significantly different from vehicle-exposure (n = 5–7 animals per condition). While the small sample size precluded rigorous analysis, when analyzed by sex, no significant differences were found between vehicle- and TCDD-exposed mice following microglial repopulation (n = 2–3 animals per group). mRNA expression was normalized to the expression of three reference genes, Gapdh, β-Actin, and Eif2b1. Graphs show individual data points and mean ± SEM.

