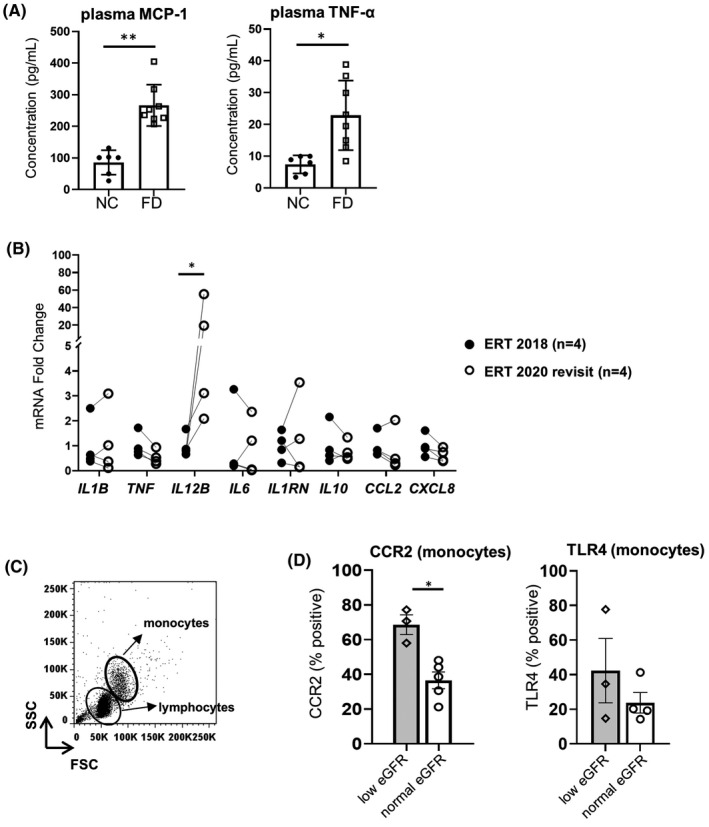
FIGURE 1.

Baseline immune profiles in plasma and peripheral blood mononuclear cells (PBMCs) from enzyme replacement therapy (ERT)‐treated Fabry disease (FD) patients. (A) Plasma MCP‐1 and TNF‐α levels in ERT‐treated FD patients (n = 8) versus normal controls (NCs) (n = 6). (B) Comparison of indicated gene transcript levels in PBMCs from ERT patients with normal eGFR after 2 years of ERT (n = 4). (C) Representative dot plot of gating lymphocyte and monocyte subpopulations in PBMCs isolated from the whole blood of one patient. (D) Monocyte fraction expressing surface CCR2 and TLR4 in ERT‐treated FD patients with indicated eGFR using the same gating strategy as in A. eGFR >60 denotes eGFR levels >60 ml/min/1.73 m2, while eGFR <60 indicates eGFR <60 ml/min/1.73 m2. In (A) and (D), bar graphs show the mean ± SD. Statistical significance was determined by Mann–Whitney or Wilcoxon test. *p < .05, **p < .01
