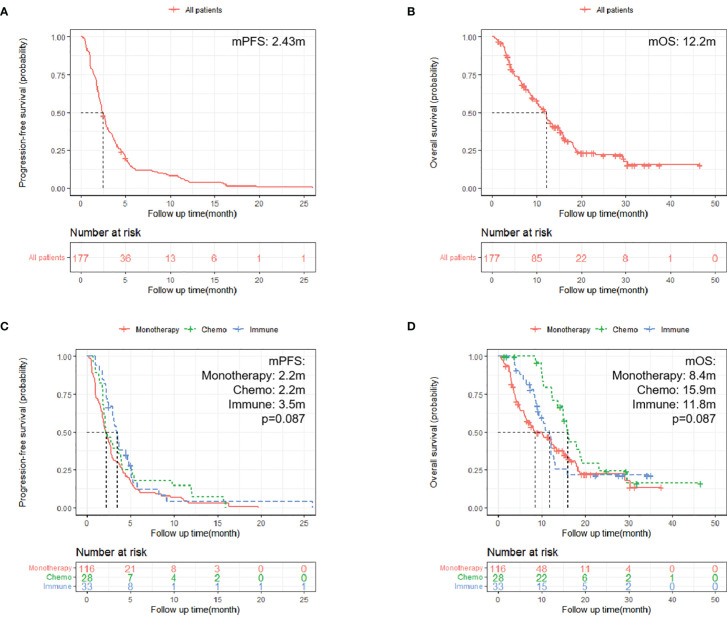
Figure 2.
Kaplan–Meier survival curves. (A, B) Kaplan–Meier survival curves of all patients on PFS and OS [(A) PFS of all 177 patients; (B) OS of all 177 patients]; (C, D) Kaplan–Meier survival curves of different treatment patterns [(C) PFS of patients in three groups, p = 0.087; (D) OS in patients in three groups, p = 0.087].

