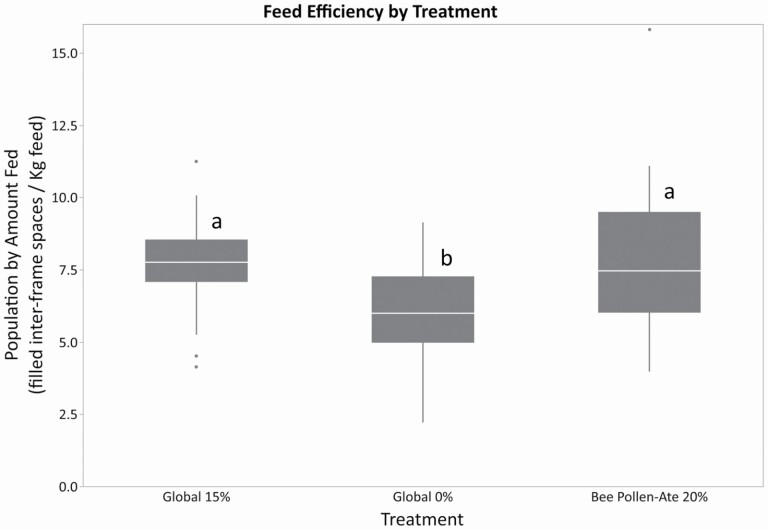
Fig. 3.
Feed efficiency (prepollination cluster score/total feed consumed) of the three feed treatments in 2019. The three feed treatments were: Global 15% (containing 15% bee-collected pollen by weight), Global 0% (contain no pollen), and Bee Pollen-Ate (produced using 20% of Bee Pollen-Ate by weight of the dry feed). Honey bee colonies fed the Global 15% and Bee Pollen-Ate feeds had higher populations for the amount of feed consumed compared to the Global 0% feed. Within each box, horizontal white lines denote the median value. The boxes extend from the 25th to the 75th percentile with vertical extending lines denoting the adjacent values (1.5× the interquartile range of the 25th and 75th percentile of each group). Dots denote outliers outside the range of adjacent values. Different letters indicate significantly feed efficiency among feed treatments as indicated by Tukey's HSD test (α ≤ 0.05).

