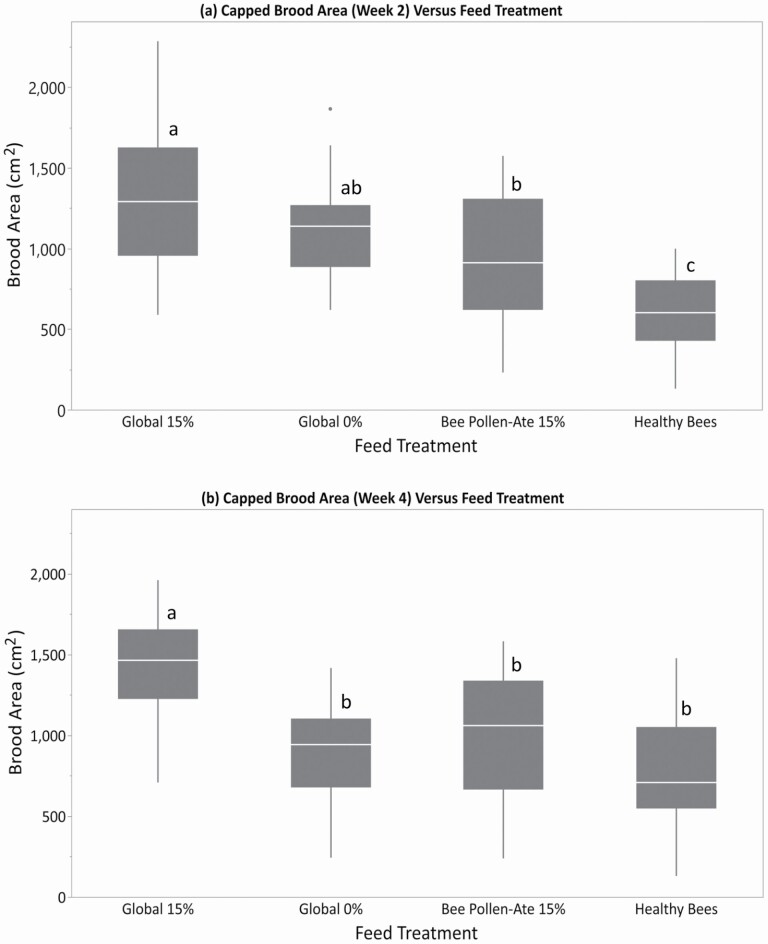
Fig. 4.
Size of honey bee colonies versus feed treatment in spring 2020. The amount of capped brood (pupae) at (a) 2 wk and (b) 4 wk after the start of the feeding trial. The four feed treatment groups were: Global 15% (containing 15% bee-collected pollen by weight), Global 0% (contain no pollen), Bee Pollen-Ate (produced using 15% of Bee Pollen-Ate by weight of the dry feed), and Healthy Bee (produced with spirulina algae-based protein). Different letters indicate significantly different colony sizes among feed treatments as indicated by Tukey's HSD test (α ≤ 0.05). Colonies fed the Global 15% feed had the greatest amount of capped brood at both time points, but differences among the other feed treatments were apparent only at 2 wk. Within each box, horizontal white lines denote the median value. The boxes extend from the 25th to the 75th percentile with vertical extending lines denoting the adjacent values (1.5× the interquartile range of the 25th and 75th percentile of each group).

