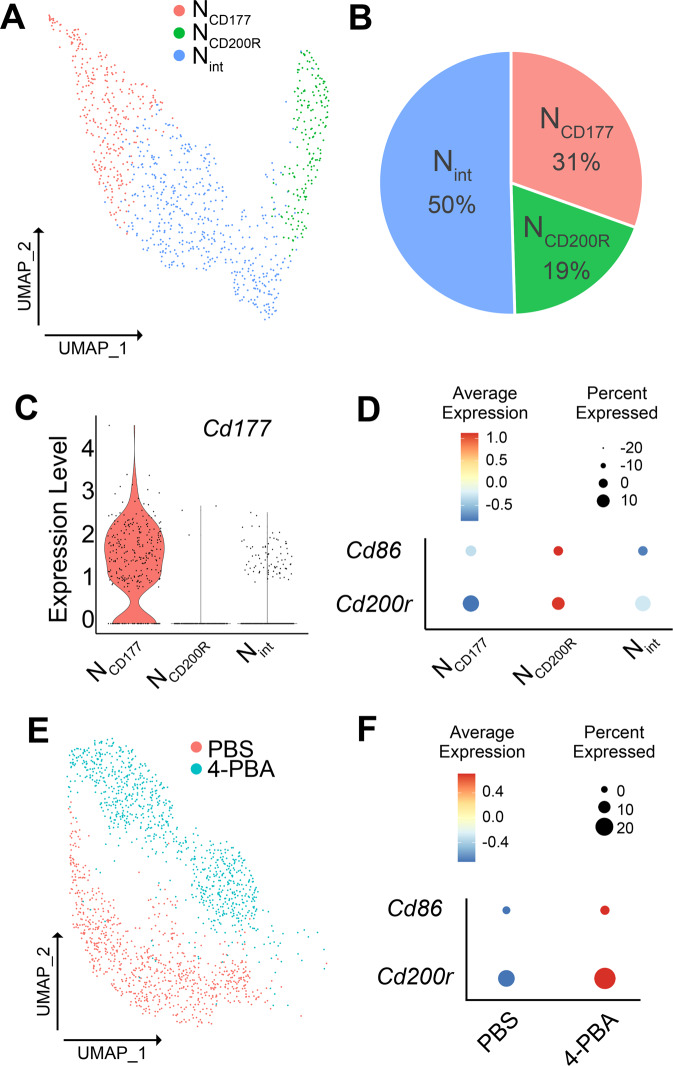
Fig. 1. scRNAseq analysis of WT BM neutrophils.
A The UMAP diagram of three subsets of neutrophils (exhausted NCD177; resolving NCD200R; and intermediate Nint). B Relative percentages of three neutrophil subsets collected from naive WT mice bone marrow. C The violin plot of Cd177 expression in three neutrophil subsets. D The bubble plot analysis of Cd200r and Cd86 expression in three neutrophil subsets. E The UMAP diagram of neutrophils subjected to PBS or 4-PBA treatment. F The bubble plot analysis of Cd200r and Cd86 levels in PBS or 4-PBA-treated neutrophils.

