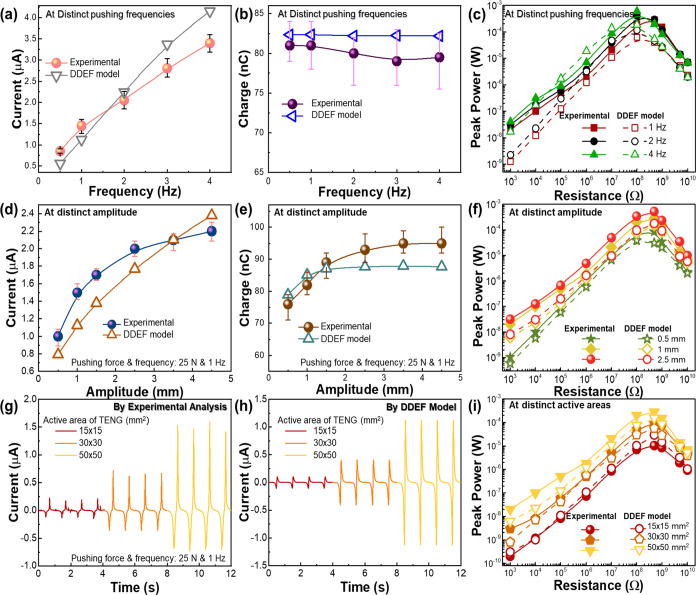
Figure 3.
Electrical output response of C@PW-TENGs as a function of frequency, amplitude, and active area. Comparison of experimentally measured peak ISC and QSC values of the C@PW-TENG against the DDEF theoretical simulation results, under an increasing (a,b) mechanical pushing frequency from 0.5 to 4 Hz, and (d,e) amplitude ranging from 0.5 to 4.5 mm; error bars specify the standard deviation of 50 readings. (g) Measured and (h) DDEF theoretical simulation electrical output ISC curves of the C@PW-TENG, against increasing the surface area of active materials. Peak output power values of the C@PW-TENG noticed by the experimental and DDEF simulation studies against distinct (c) mechanical pushing frequencies, (f) amplitudes, and (i) surface areas.

