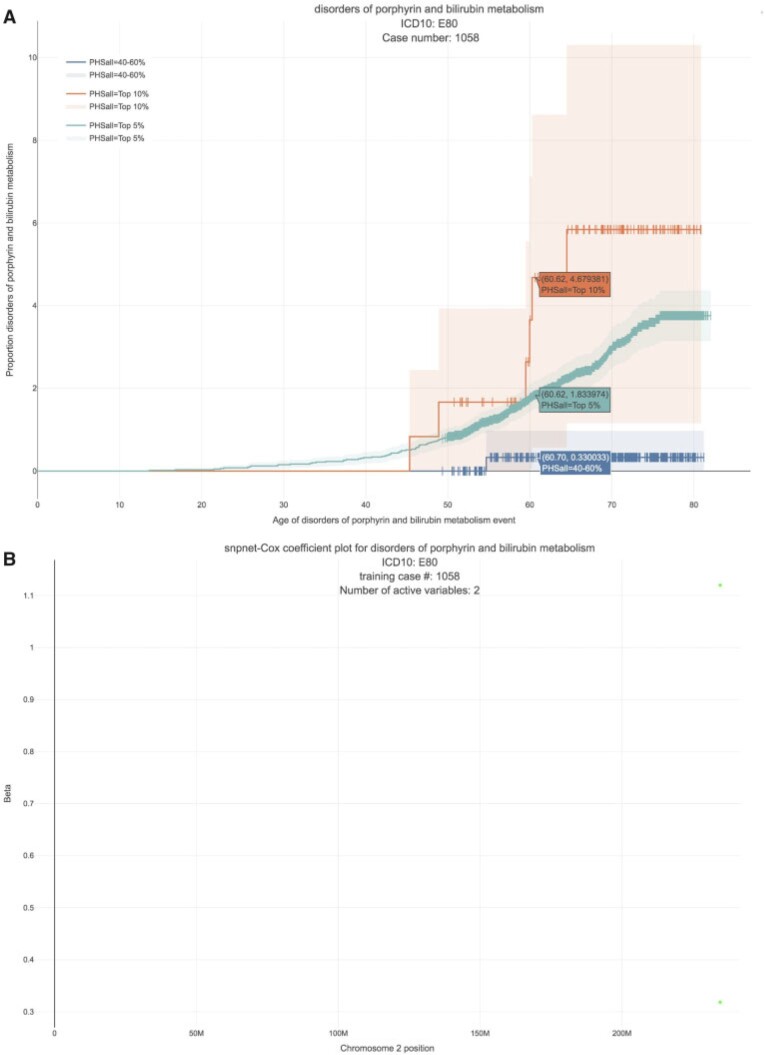
Fig. 4.
Disorders of porphyrin and bilirubin metabolism. (A) The Kaplan–Meier curves for percentiles of PHS for variants selected by snpnet-Cox, in the held out test set (orange: top  , green: top
  , red: top
  , blue: 40–60
 , and brown: bottom 10
 ; ticks represent censored observations. Highlighted are the proportion of disorders of porphyrin and bilirubin metabolism events by age 60 across the percentile scores. (B) Plot of snpnet-Cox coefficients for disorders of porphyrin and bilirubin metabolism with
  active variables. Green dots represent protein-altering variants.

