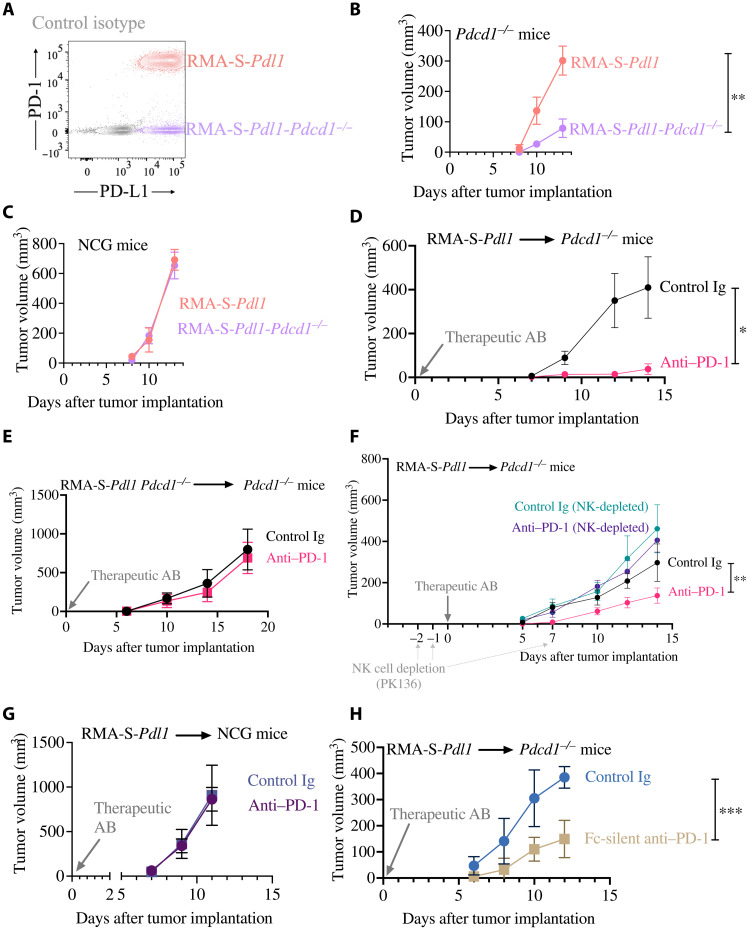
Fig. 6. PD-1 blockade is effective in Pdcd1−/− mice when NK cells are present and tumor cells express PD-1.
(A) PD-1 and PD-L1 expression in RMA-S-Pdl1 or RMA-S-Pdl1-Pdcd1−/− cells was analyzed by flow cytometry. (B to H) In all experiments, the indicated cell lines were resuspended in Matrigel and injected, alone or mixed with different PD-1 blocking or control antibody. Tumor growth was assessed over time, and data were analyzed with two-way ANOVA. (B) n = 6 per group; the experiment depicted is representative of two performed with similar results. (C) n = 6 per group; the experiment depicted is representative of two performed with similar results. (D) n = 4 per group; the experiment depicted is representative of two performed with similar results. (E) n = 6 per group; the experiment depicted is representative of three performed with similar results. (F) n = at least 5 per group; the experiment depicted is representative of two performed with similar results. (G) n = 5 per group; the experiment depicted is representative of two performed with similar results. (H) n = 5 per group; the experiment depicted is representative of two performed with similar results. *P < 0.05; **P < 0.01; ***P < 0.001.

