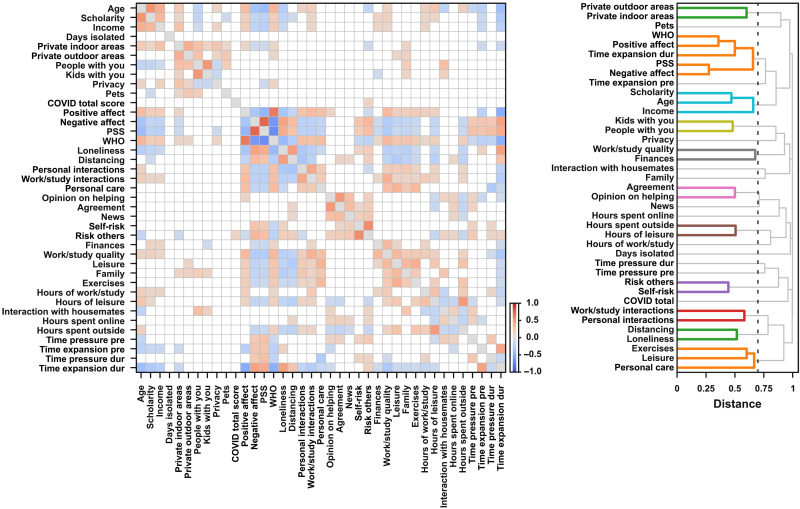
Fig. 2. Pairwise correlations between measures and hierarchical cluster analysis in the first session.
(Left) Pairwise Spearman correlations across measures in the first session. Only effects stronger than 0.1 are presented. The color of individual points indicates the sign and strength of the estimated coefficients. (Right) The estimated dendrograms using hierarchical clustering analyses of the calculated distances between scales (distance = 1 − |rho|). The black vertical lines represent the cut threshold, which was defined at a distance between scales with a correlation of medium effect size (|rho| = 0.3). Links connecting nodes with distances smaller than or equal to the threshold are marked as belonging to the same cluster.

