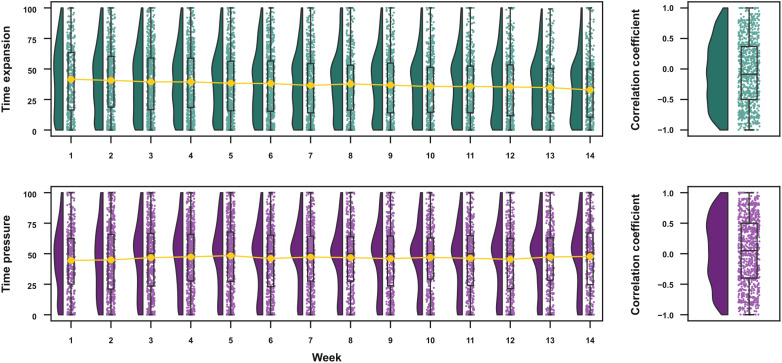
Fig. 4. Evolution of time awareness across weeks.
Raincloud plots showing group distributions as unmirrored violin plots (probability density functions), boxplots with medians and IQRs, whiskers with 5th and 95th percentiles, and individual data points (horizontally jittered). (Right) The distribution of correlation coefficients between week and time expansion and pressure across participants.

