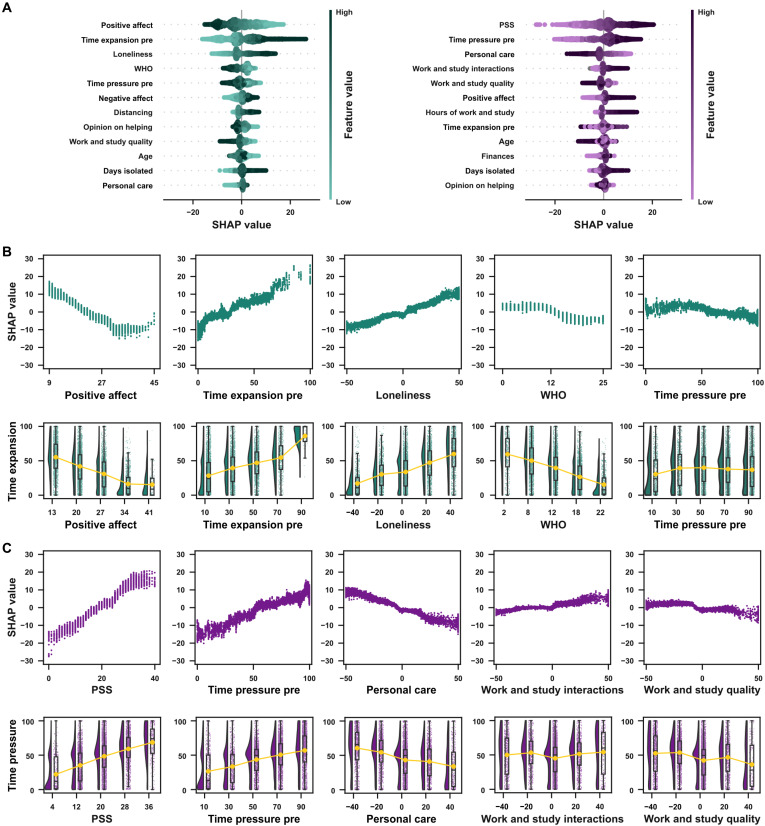
Fig. 6. Factors associated with distortions in the time awareness during the weekly sessions.
(A) SHAP summary plots for time expansion (left) and time pressure (right). The summary plots show a combination of feature importance with feature effects. Each point is a SHAP value for a feature and an instance. Each line represents a feature, and the x axis is the SHAP value (on the same scale as the time awareness VAS). The color represents the value of the feature from low to high. Overlapping points are jittered on the y axis direction, allowing a sense of the distribution of the SHAP values per feature. Features are ordered according to their importance. (B) Factors associated with distortions in time expansion. Top: SHAP dependence plots for the five features with the highest SHAP values for time expansion. Each plot shows, for each data instance, the feature value on the x axis and the corresponding SHAP value on the y axis. The SHAP value describes the behavior of the model for different values of a given feature. Bottom: Raincloud plots for each feature. The feature of interest is binned in five equally distanced values in each plot, and time expansion values for each bin are shown. (C) Factors associated with distortions in time pressure. The plots follow the same patterns as (B).

