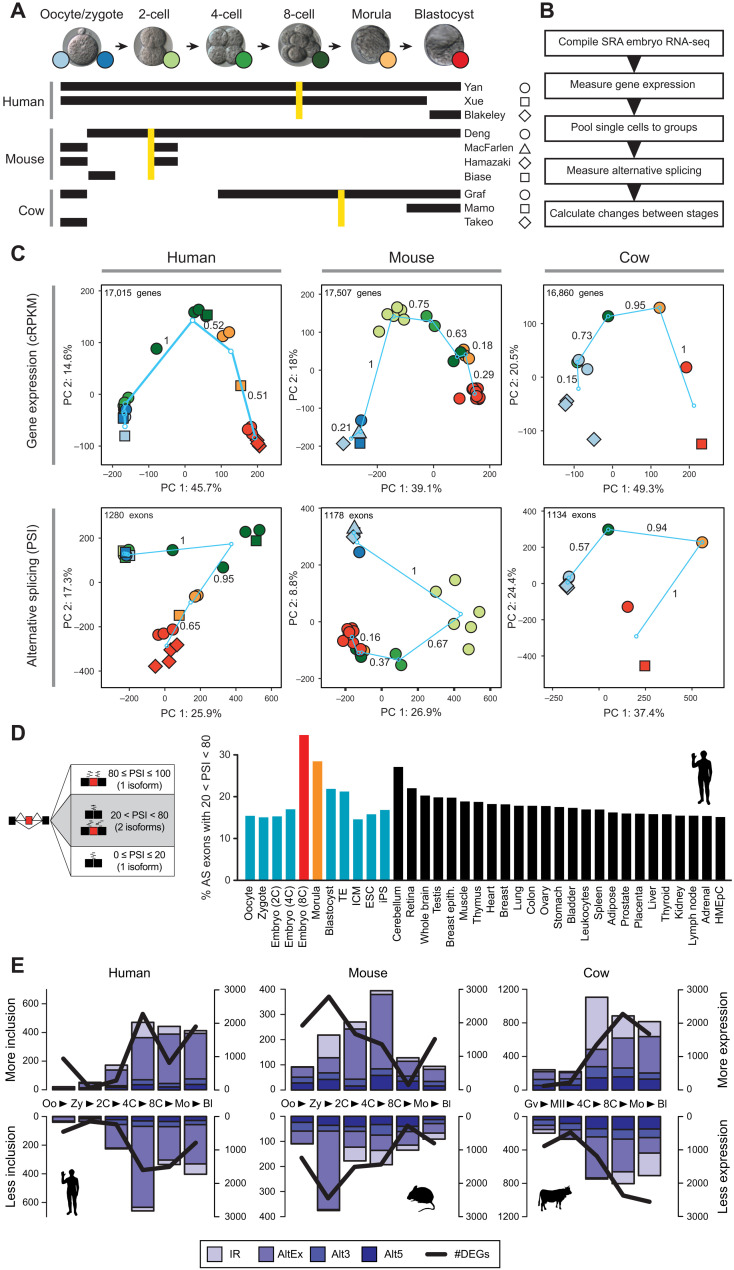
Fig. 1. AS profiles during early development reveal the highest exon skipping diversity at ZGA.
(A) Summary of datasets used in this study for each species. Golden lines indicate the major wave of ZGA for each species. (B) Schematic view of the methodological steps taken to process the RNA-seq data and obtain AS quantifications with vast-tools. SRA, Short Read Archive. (C) PCA for the merged groups of samples per stage for GE {top; cRPKMs [corrected (for mappability) reads per kilobase of transcript per million mapped reads]} and AS (bottom; exons with sufficient read coverage in at least 80% of the samples). Color codes and shapes for each stage as depicted in (A). Turquoise circles represent the centroids of each stage, and lines show the change between consecutive stages, with values representing the relative change respect to the largest change (=1). PSI, percent-spliced-in. (D) Percentage of exons with 20 < PSI < 80 (i.e., generating two substantial isoforms) in each sample was calculated for every stage and differentiated tissue, showing the highest relative exon skipping diversity for the ZGA stage. Equivalent plots for mouse and cow are shown in fig. S5A. Trophectoderm (TE), Inner Cell Mass (ICM); Embryonic Stem Cells (ESC); induced Pluripotent Stem cells (iPS); Human Mammary Epithelial Cells (HMEpC). (E) Numbers of alternative exons (AltEx), alternative 3/5′ splice sites (Alt3/5) and retained introns (IR) with increased/decreased inclusion levels in consecutive pairwise transitions (bars, left y axes) or genes with higher/lower expression (DEGs) (line, right y axes). Each data point represents the change in inclusion/expression between the stages at each side of the arrowhead in the x axis (e.g., Oo > Zy). Oo, oocyte; Zy, zygote; Mo, morula; Bl, blastocyst; Gv, oocyte GV; and MII, oocyte MII.

