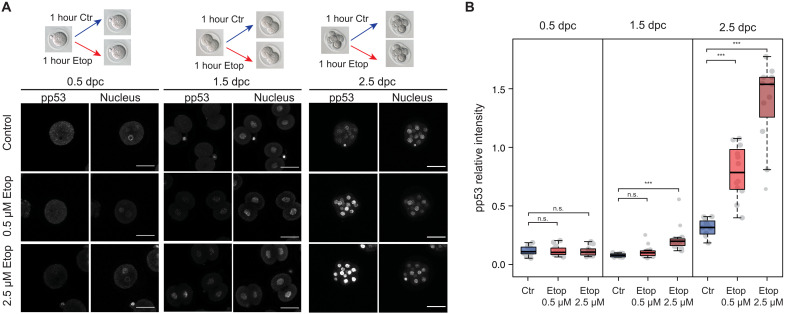
Fig. 3. Mouse embryos at ZGA have a lower response to DNA damage induced by etoposide.
(A) Scheme of etoposide treatment and immunostaining for phospho-p53 (Ser15; pp53). Scale bars, 50 μm. (B) Quantification of nuclear phospho-p53 (Ser15) levels from embryos is shown for each stage. Each dot represents the average relative intensity of all cells of a single embryo. Box plots show staining levels of embryos from one representative experiment. Two more experiments are shown in fig. S16C. Number of embryos: n = 12 (control, 1C), n = 14 (0.5 μM etoposide, 1C), n = 14 (2.5 μM etoposide, 1C), n = 14 (control, 2C), n = 15 (0.5 μM etoposide, 2C), n = 15 (2.5 μM etoposide, 2C), n = 11 (control, morula), n = 12 (0.5 μM etoposide, morula), and n = 11 (2.5 μM etoposide, morula). ***P < 0.001 based on Wilcoxon rank sum tests. n.s., not significant. days post coitum (dpc).

