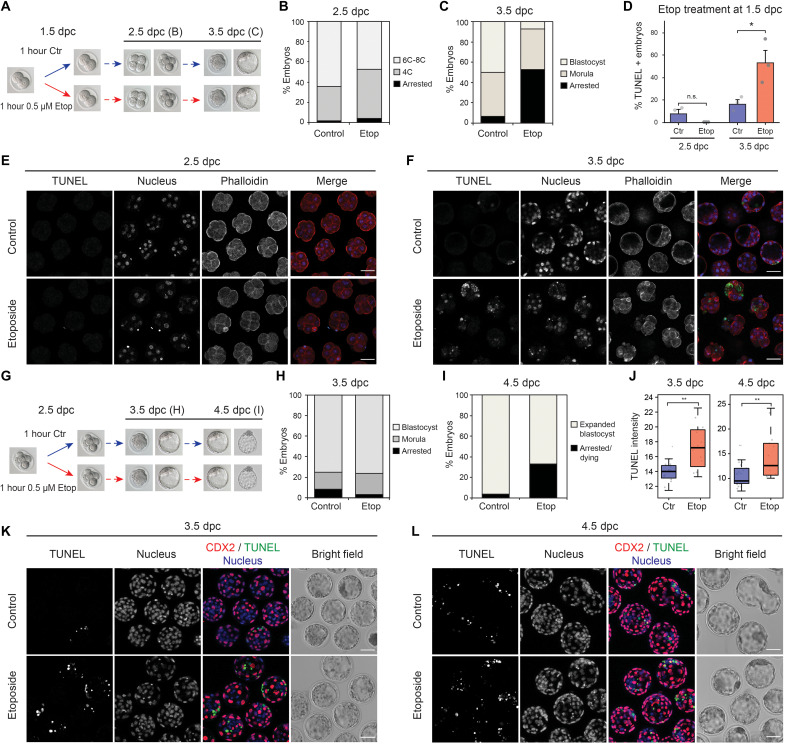
Fig. 4. Mouse embryos treated with etoposide at ZGA present a delayed DDR that results in a high rate of developmental arrest.
(A) Scheme of etoposide treatment: 2C embryos were left untreated or treated with 0.5 μM etoposide for 1 hour and then left to recover for further 48 hours. (B and C) Proportion of embryos found arrested or developed to the stated stage 24 hours (B) or 48 hours (C) after treatment. Average of six independent experiments. Total number of embryos: n = 105 (control) and n = 113 (treated). (D) Percentage of embryos showing positive TUNEL staining at each developmental stage. Average of three independent experiments is shown. Total number of embryos: n = 72 (control, 2.5 dpc), n = 63 (etoposide, 2.5 dpc), n = 67 (control, 3.5 dpc), and n = 50 (etoposide, 3.5 dpc). *P = 0.036, two-sided Student’s t test. Error bars represent SEM. (E and F) TUNEL staining of embryos in (B) and (C). (G) Scheme of etoposide treatment: Early morula embryos were left untreated or treated with 0.5 μM etoposide for 1 hour and then left to recover for further 48 hours. (H and I) Proportion of embryos found arrested or developed to the stated stage 24 hours (H) or 48 hours (I) after treatment. Average of two independent experiments. Total number of embryos: n = 45 (control) and n = 44 (treated). (J) Quantification of TUNEL staining intensity in morphologically normal blastocysts from (H) and (I). Each dot represents one embryo. A representative experiment is shown. Total number of embryos: n = 16 (control, 3.5 dpc), n = 12 (etoposide, 3.5 dpc), n = 26 (control, 4.5 dpc), and n = 13 (etoposide, 4.5 dpc). Another experiment is shown in fig. S17D. **P < 0.01 based on Wilcoxon rank sum tests. (K and L) Double staining of TUNEL and the trophectoderm marker CDX2 of embryos in (H) and (I). In (B) and (C), “Arrested” embryos represent those not reaching the expected developmental stage because of either cell death or cell cycle arrest. Bar plots corresponding to (B), (C), (H), and (I) are shown in fig. S17 (A and B). Scale bars, 50 μm (E, F, K, and L).

