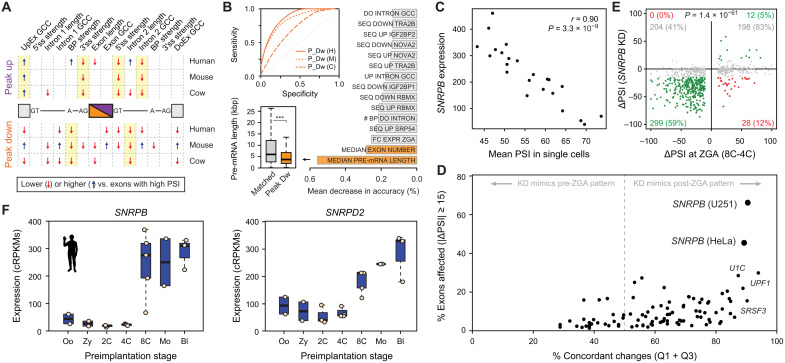
Fig. 5. Snrpb and Snrpd2 are activated during ZGA and are associated with peak exons.
(A) Intron-exon features associated with ZGA peak-down or peak-up exons. Blue/red arrows indicate features with statistically significantly higher/lower median values compared to exons with high PSI (two-sided Mann-Whitney U tests). Full comparisons with exons with high/low PSI and control sets with matched pre-ZGA PSIs and value distributions are in file S1. UpEx, Upstream Exon; GC Content, GCC; BP, Branch Point; DoEx, Downstream Exon. (B) Top inset: Receiver Operating Characteristic (ROC) curves for Random Forest classifiers for peak-down exons (H: human, AUC = 0.852; M: mouse, AUC = 0.818; C: cow, AUC = 0.678). Bar plot shows top-ranking features based on mean decrease in accuracy averaged for the three species. Bottom inset: Distribution of pre-mRNA lengths for human peak-down exons and a control set of exons with matched pre-ZGA PSI distributions. ***P < 0.001 based on Wilcoxon rank sum tests. (C) Correlation at the single-cell level between human SNRPB expression and the mean PSI for peak-down exons. (D) Associations between human splicing factor knockdowns (KD) and exons from Mfuzz clusters that peak at ZGA (up and down). Y axis shows percentage of exons affected by the knockdown (|ΔPSI| ≥ 15). X axis shows concordance of the direction of change in the knockdown respect to the change at ZGA [in Cartesian axes as per (E), those in quadrants 1 and 3 (Q1 + Q3)]. (E) Scatter plot showing ΔPSI of ZGA peak exons upon SNRPB knockdown in U251 cells (y axis) versus ΔPSI at ZGA (8C-4C; x axis). Exons with |ΔPSI| ≥15 upon knockdown are green/red; gray, exons with no change. Percentages are given respect to exons with increased or decreased PSI at ZGA. P value: two-sided binomial test between Q1 + Q3 versus Q2 + Q4. U251 data from (72). (F) Expression of SNRPB and SNRPD2 in human early development. Mouse and cow plots in fig. S20B.

