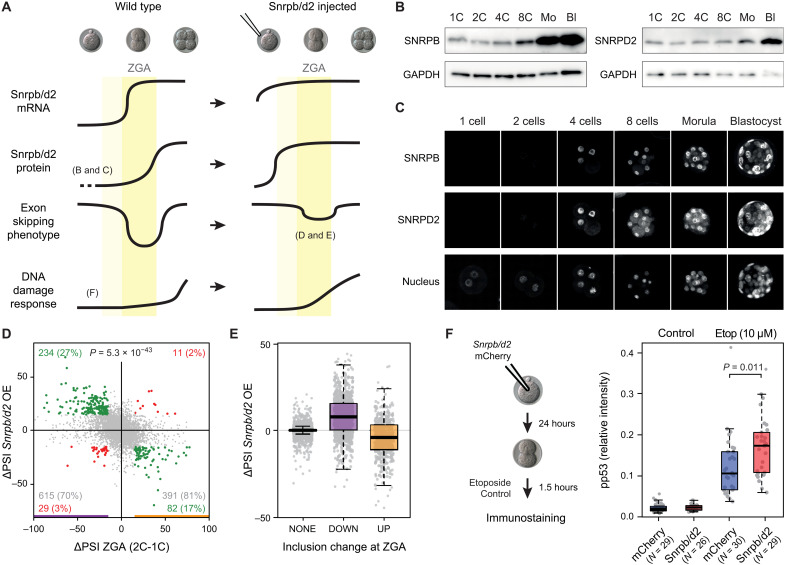
Fig. 6. Snrpb and Snrpd2 are partly responsible for peak-down exons affecting DDR at ZGA.
(A) Model for peak-down exon regulation during ZGA. Left (Wild type): Snrpb and Snrpd2 have low maternal mRNA and protein levels. At ZGA, mRNA levels increase, but the rise in protein levels is delayed, leading to exclusion of sensitive exons in newly transcribed genes. This situation starts being restored after ZGA, when SNRPB and SNRPD2 protein levels reach sufficient amounts. Aberrant exclusion of exons in DDR genes contributes to a delay in DDR at ZGA. Right: Induced expression of Snrpb/d2 before ZGA should prevent the abovementioned exon skipping in DDR genes and therefore enable an earlier stronger DDR. (B and C) Western blot and immunostaining showing SNRPB and SNRPBD2 levels during mouse development. GAPDH, glyceraldehyde-3-phosphate dehydrogenase. (D) Changes in exon PSIs at 2C stage upon early induced expression of Snrpb/d2 (y axis) respect to changes at ZGA (2C-1C; x axis). Exons with |ΔPSI| ≥ 15 or |ΔPSI| < 15 upon Snrpb/d2 expression and at ZGA are highlighted in green/red or gray. Percentages among ZGA-changing exons are indicated. P value: two-sided binomial test (Q2 + Q4 versus Q1 + Q3). OE, overexpression. (E) ΔPSIs upon Snrpb/d2-induced expression for all exons with increased (UP), decreased (DOWN), or no change (NONE) in PSI at ZGA. (F) Pronuclear stage embryos were injected with Snrpb/d2 or mCherry mRNA and left to develop to the 2C stage, when they were treated for 1.5 hours with 10 μM etoposide or left untreated. Box plots show nuclear phospho-p53 (Ser15) relative intensity. Each dot represents the average relative intensity of both cells of a single embryo. Data from three independent experiments (individual experiments in fig. S23). P value calculated from the differences between least squares means based on a generalized linear mixed model that incorporates the batch as a random effect.

