Figure 2.
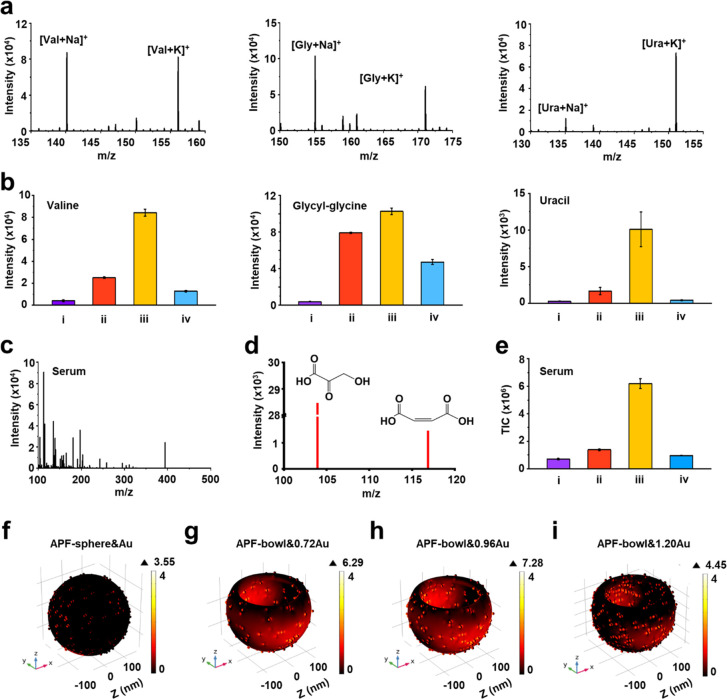
Exploration of APF&Au chips for LDI MS detection. (a) Typical mass spectra using APF-bowl&0.96Au for detecting standard small metabolites of valine (Val), glycyl-glycine (Gly), and uracil (Ura). The [M + Na]+ and [M + K]+ are separately labeled. (b) Mean signal intensities based on three independent experiments for [M + Na]+ of standard small metabolites by using (i) APF-sphere&Au, (ii)APF-bowl&0.72Au, (iii) APF-bowl&0.96Au, and (iv) APF-bowl&1.20Au. (c) The representative mass spectrum from a serum sample using APF-bowl&0.96Au (m/z of 100–500). (d) Two small metabolites of hydroxybutyric acid (m/z of 103.95) and maleic acid (m/z of 116.84) detected in the representative mass spectrum, reported as the biomarkers for ovarian cancer. (e) The averaged TIC for a serum sample based on three independent experiments, by using the matrix of (i) APF-sphere&Au, (ii)APF-bowl&0.72Au, (iii) APF-bowl&0.96Au, and (iv) APF-bowl&1.20Au. The plots of EM field amplitudes for (f) APF-sphere&Au, (g) APF-bowl&0.72Au, (h) APF-bowl&0.96Au, and (i) APF-bowl&1.20Au. The EM field is shown as log(|E|2/|E0|2), where E and E0 refer to the enhanced field and incident laser, respectively. The results of panels f–i were obtained by the simulation of finite element method with laser wavelength of 355 nm injected along the z-axis and laser beam polarized along the x-axis.

