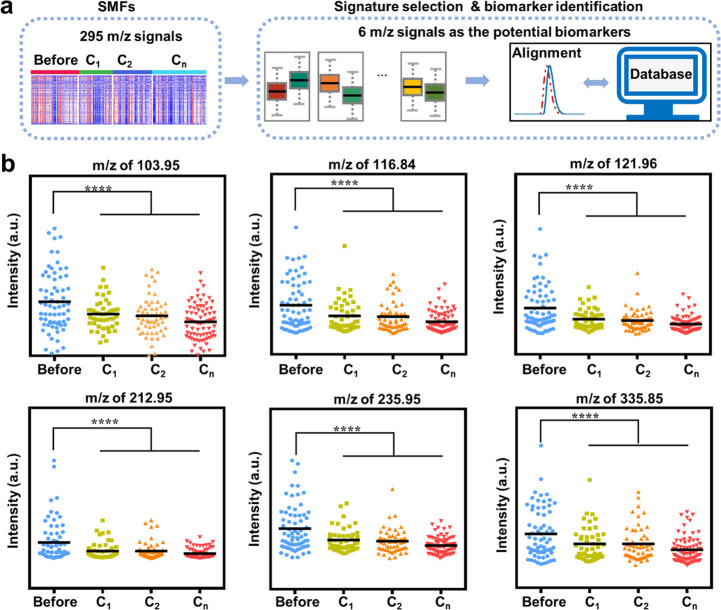
Figure 4.
Potential biomarkers for chemotherapy monitoring. (a) The workflow for screening out the potential biomarkers from SMFs of 295 m/z signals. For signature selection, six m/z signals were screened out with significant differences before and after chemotherapy of ovarian cancer patients. For biomarker identification, six potential biomarkers were identified by accurate mass measurements and alignment with the metabolite database. (b) Scatter plots of potential biomarkers among ovarian patients before chemotherapy and after chemotherapy of C1/C2/Cn (n ≥ 5). The significant difference between ovarian patients before and after chemotherapy was measured by the statistical test, and a gradual decrease trend was found as the chemotherapy cycle proceeded. **** indicates p< 0.0001.

