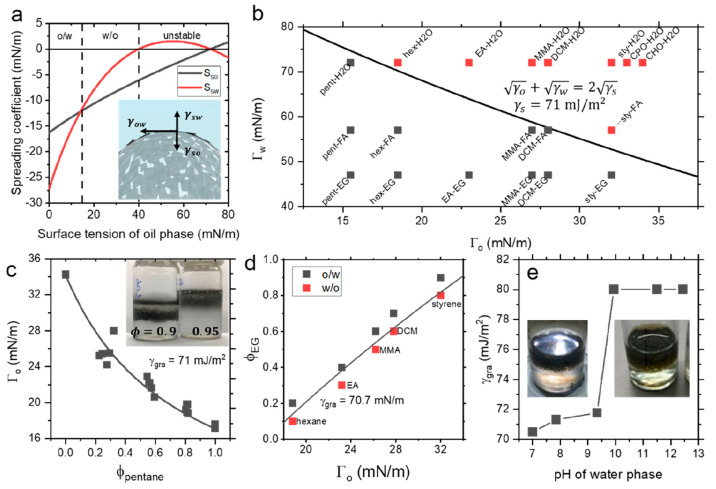
Figure 3.
(a) Calculated spreading coefficients for emulsions of graphene and water (using γ = 70 and 101 mJ/m2, respectively) as a function of oil phase surface tension and the inset showing three-phase boundary at emulsion interface. (b) Surface tension phase diagram showing different compositions giving rise to w/o (black) and o/w (red) emulsions that is well described by eq 6 with a surface energy of ∼71 mJ/m2 for all pristine nanosheets studied here. (c) Surface tension of oil as a function of pentane volume fraction as an inversion experiment to determine surface energy, giving a value in good agreement with above measurements. (d) Volume fraction of ethylene glycol required for inversion as a function of oil phase surface tension for washed surfactant-exfoliated graphene, indicating that stabilization is still dictated by the nanosheets. (e) Nanosheet surface energy as a function of pH of the water phase, determined by pentane/CHO inversion. Inset: Photograph of buoyant cycloketone droplets in water continuous phase, inverted at elevated pH, shown for graphene (left) and MoS2 (right).

