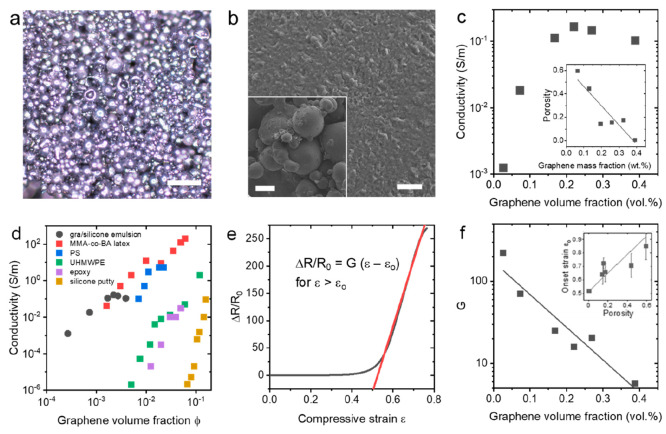
Figure 4.
(a) Optical micrograph of emulsion-templated silicone composite shows graphene-coated surfaces and retained droplet structure; scale bar 200 μm. (b) Scanning electron micrographs of emulsion-droplet surfaces showing conductivity and graphene–polymer interface; scale bar 5 μm. Inset: Micrograph of emulsion composite showing droplet connectivity; scale bar 100 μm. (c) Electrical conductivity of composites as a function of loading level showing a sharp increase from lowest-loading high-porosity samples and saturation at higher loadings. Inset: Porosity of composites as a function of loading level determined by density measurements. (d) Conductivity-volume fraction comparison to composites from the literature based on pristine graphene in matrices of methyl methacrylate-butyl acrylate copolymer latex (MMA-co-BA latex),39 polystyrene (PS),40 ultrahigh molecular weight polyethylene (UHMWPE),41 epoxy,42 and silicone putty,36 highlighting the appreciable conductivity and ultralow loading level in the nanosheet-stabilized emulsion networks. (e) Representative relative resistance change as a function of compressive strain showing flat region associated with porosity, followed by a high-sensitivity linear region with potential for electromechanical sensing applications. (f) Compressive gauge factor extracted from the linear region showing high sensitivity decreasing exponentially with the loading level, as expected for nanocomposite sensors. Inset: Onset strain for the electromechanical response as a function of porosity showing linear correlation.

