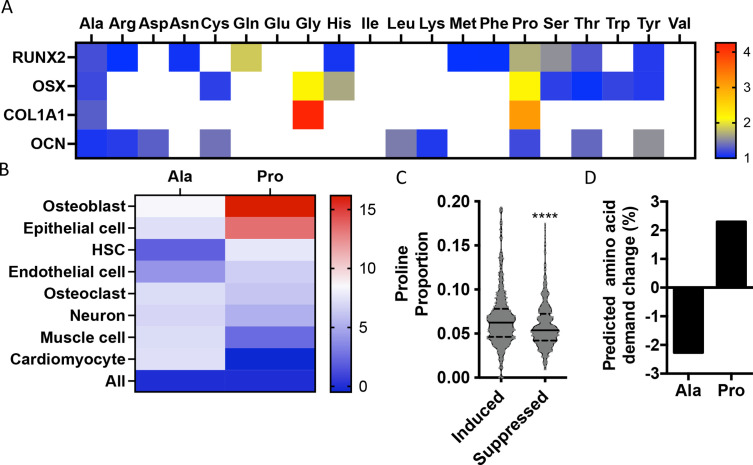
Figure 1. Osteoblast proteins are enriched with the amino acid proline.
(A) Heat map depicting the relative amino acid enrichment for the indicated osteoblast proteins. Color bar represents fold enrichment relative to the average amino acid content. White boxes denote below-average enrichment. (B) Heat map depicting alanine or proline enrichment in differentiation-associated proteins. Color bar represents the percent increase in abundance relative to all proteins. (C) Volcano plot depicting the proline proportion of the top 500 genes that are induced or suppressed during osteoblast differentiation. Dashed lines denote quartiles while the solid line denotes the median. ****p≤0.00005 by unpaired two-tailed Student’s t-test. (D) Graphical depiction of the predicted change in demand for alanine or proline based on changes in gene expression during osteoblast differentiation. See numerical source data and RNAseq source data in Figure 1—source data 1.


