. 2022 Mar 9;11:e76963. doi: 10.7554/eLife.76963

Figure 3. Proline is essential for the synthesis of proline-enriched osteoblast proteins.

(A) Western blot analyses of naïve calvarial cells cultured in 0.3 mM or 0 mM proline for 48 hr (n = 3). In all blots, the percent proline composition is noted under the protein name. Protein expression normalized to total protein. Fold change ± SD for three independent experiments. (B) Correlation analysis of protein expression as a function of the proline composition of proteins in naïve calvarial cells cultured in media containing either 0 mM or 0.3 mM proline for 48 hr. (C–G) The effect of proline availability on the synthesis of select proteins (n = 3). CHX, cycloheximide. Error bars depict SD. *p≤0.05 by unpaired two-tailed Student’s t-test. See numerical source data and uncropped Western blot images in Figure 3—source data 1.

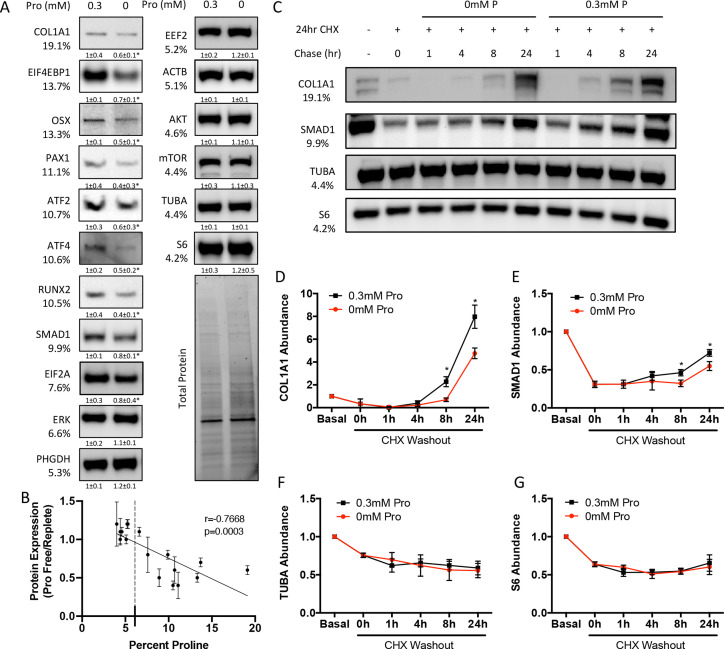
Figure 3—source data 1. Numerical and uncropped western blot source data for Figure 3.

Figure 3.

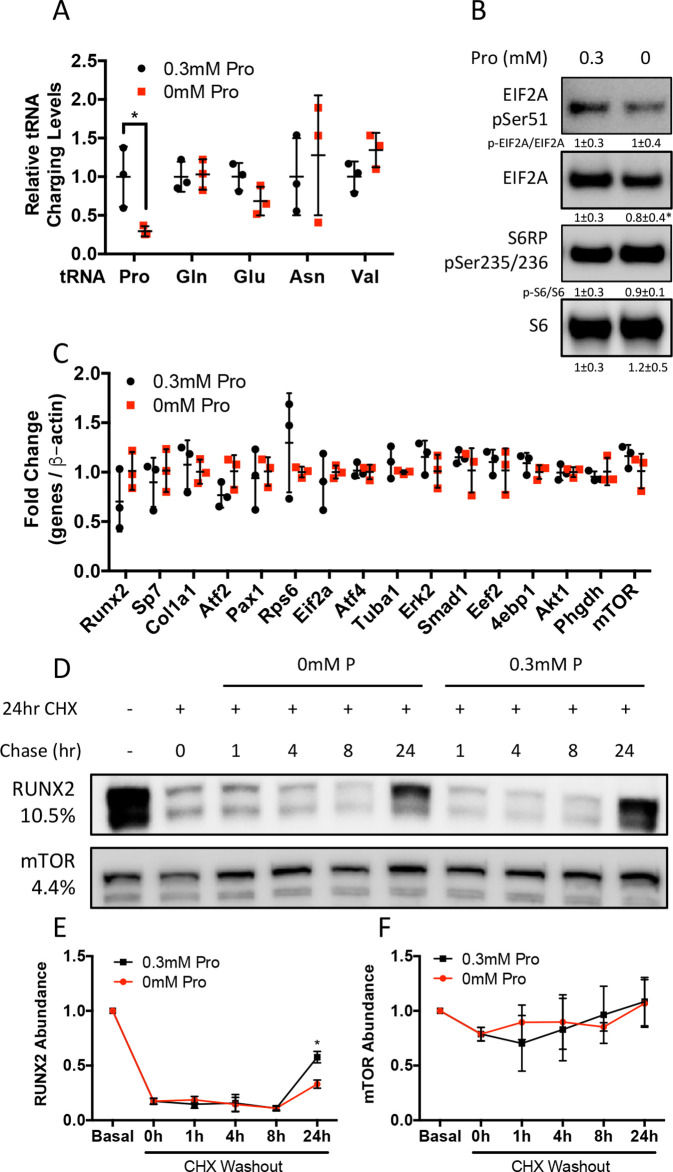
Figure 3—figure supplement 1. Proline is essential for the synthesis of proline-enriched osteoblast proteins.

Figure 3—figure supplement 1.

(A) Effect of 48 hr proline withdrawal on tRNA aminoacylation (n = 3). (B) Western blot analysis of naïve calvarial cells cultured in 0.3 mM or 0 mM proline for 48 hr (n = 3). Phosphorylated EIF2A normalized to total EIF2A while phosphorylated S6RP normalized to total S6RP. Individual proteins normalized to total protein. Fold change ± SD for three independent experiments. (C) qRT-PCR analysis of the effect of 48 hr proline withdrawal on gene expression in calvarial cells (n = 3). (D–F) The effect of proline availability on the synthesis of select proteins. CHX, cycloheximide. Fold change ± SD for three independent experiments. Error bars depict SD. *p≤0.05 by unpaired two-tailed Student’s t-test. See numerical source data and uncropped Western blot images in Figure 3—figure supplement 1—source data 1.
Figure 3—figure supplement 1—source data 1. Numerical and uncropped western blot source data for Figure 3—figure supplement 1.