. 2022 Feb 25;11:e74595. doi: 10.7554/eLife.74595

Figure 2. Kdm6b is critical for proliferation and differentiation of cranial neural crest (CNC)-derived palatal mesenchyme cells.

(A, B) Immunostaining of EdU at E13.5 after 2 hr of EdU labeling. Dotted lines indicate palatal shelf region. Dashed lines indicate the palatal region used for quantification in (C). Scale bar: 50 µm. (C) Quantification of EdU+ cells represented in (A, B). *p<0.05. (D–G) Co-localization of EdU and Ki67 at E13.5 after 48 hr of EdU labeling. Dotted lines indicate palatal shelf region. Dashed lines indicate the palatal region used for quantification in (H). (F, G) are magnified images of boxes in (D, E). Arrows in (F, G) indicate representative cells that are only EdU+, while arrowheads indicate representative cells that are positive for both EdU and Ki67. Scale bar: 50 µm. (H) Quantification of EdU and Ki67 double-positive cells represented in (D, E). *p<0.05. (I–L) Immunostaining of RUNX2 at indicated stages. Insets are higher-magnification images of boxes in (I–L). Asterisks in (J, L) indicate decreased RUNX2+ cells observed in Wnt1Cre;Kdm6bfl/fl mice. Scale bar: 50 µm. White dotted lines indicate the palatal region used for quantification in (Q). (M–P) Immunostaining of SP7 at indicated stages. Insets are higher-magnification images of boxes in (O, P). Asterisk in (P) indicates decreased SP7+ cells observed in Wnt1Cre;Kdm6bfl/fl mice. Scale bar: 50 µm. White dotted lines indicate the palatal region used for quantification in (R). (Q, R) Quantification results for RUNX2+ and SP7+ cells represented in (I–P). *p<0.05. (S–W) Osteogenic differentiation assay using Alizarin red S staining. (W) is the quantification result of Alizarin red S staining represented in (S, T). Scale bars: 2 mm in (S, T); 200 µm in (U, V). *p<0.05.

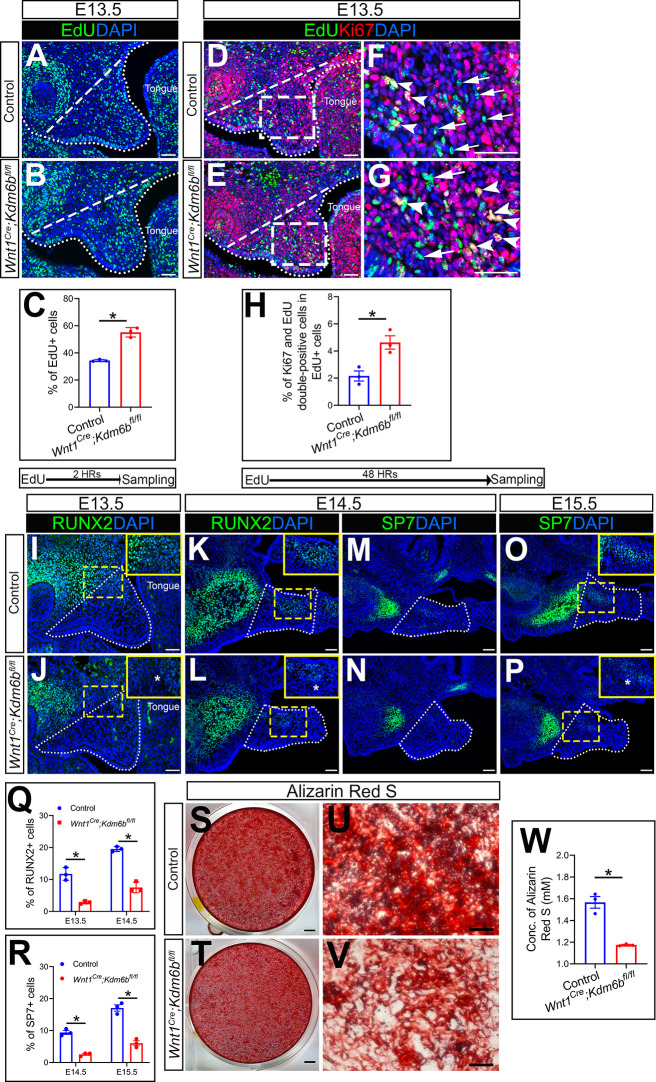
Figure 2—source data 1. Source data for Figure 2C.
Figure 2—source data 2. Source data for Figure 2H.
Figure 2—source data 3. Source data for Figure 2Q.
Figure 2—source data 4. Source data for Figure 2R.
Figure 2—source data 5. Source data for Figure 2W.

Figure 2.

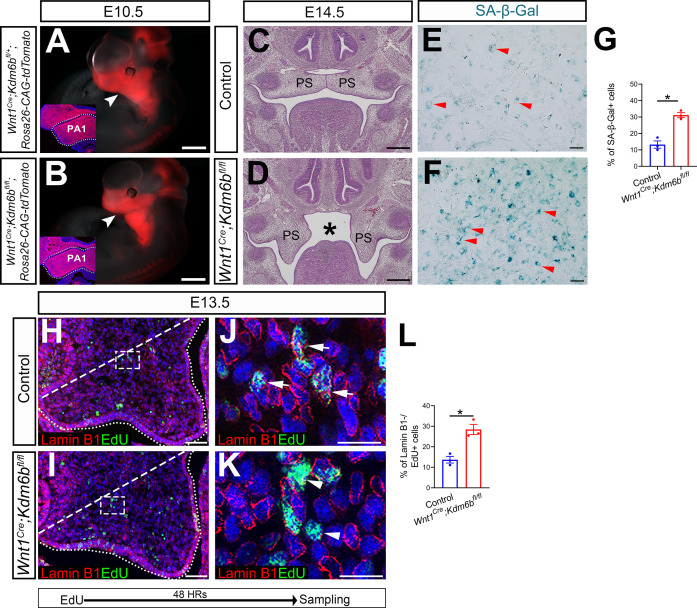
Figure 2—figure supplement 1. Kdm6b is not required for cranial neural crest cells (CNCCs) to populate pharyngeal arches but is critical for survival of palatal mesenchymal cells.

Figure 2—figure supplement 1.

(A, B) Whole-mount images of tdTomato reporter mice at E10.5. Arrowheads indicate CNCCs that have successfully migrated to the pharyngeal arch at E10.5. No differences were observed between control and Wnt1Cre;Kdm6bfl/fl mutant mice. Insets show immunostaining of tdTomato at E10.5. Dotted lines in the insets indicate first pharyngeal arch (PA1). Scale bars: 1 mm. (C, D) Histological analysis of samples at E14.5. Asterisk in (D) indicates cleft palate observed in Wnt1Cre;Kdm6bfl/fl mice. Scale bar: 100 µm. (E, F) Senescence β-galactosidase staining using cell culture from E13.5 palatal mesenchymal cells. Arrowheads in (E, F) indicate representative β-galactosidase+ cells. Scale bar: 100 µm. (G) Quantification of senescence-associated β-galactosidase activity represented in (E, F). *p<0.05. (H–K) Co-localization of EdU and Lamin B1 at E13.5 after 48 hr of EdU labeling. Dotted lines indicate palatal shelf region. Dashed lines indicate the palatal region used for quantification in (L). (J, K) are magnified images of boxes in (H, I), respectively. Arrows in (J) indicate representative cells that are positive for both Lamin B1 and EdU, while arrowheads in (K) indicate representative cells that are EdU positive and Lamin B1 negative. Scale bar: 50 µm in (H, I), 25 µm in (J, K). (L) Quantification of cells that are EdU positive and Lamin B1 negative represented in (H, I). *p<0.05.
Figure 2—figure supplement 1—source data 1. Source data for Figure 2—figure supplement 1G.
Figure 2—figure supplement 1—source data 2. Source data for Figure 2—figure supplement 1L.